
View the client's trial balance data
Once you've received and successfully imported your client's trial balance data, you can view accounts and groups using the left panel on the Data page.
Switch between planning and final balances
If planning balances are enabled, you can switch the engagement between planning and final balances on the Data page using a mode selector appears at the bottom of the left pane.
To switch balance modes:
-
On the Data page, go to the mode selector at the bottom of the left pane.
-
Select Planning or Final.
-
In the confirmation dialog, select Continue.
The page refreshes and displays the selected balance mode.
You can use this selector to correct the balance mode if the engagement remains in Planning mode after you import balances or update accounts.
View accounts
The Accounts tab in the left panel displays your client's accounts data. It mainly shows account numbers, names, preliminary balances (imported balances), final balances (after adjustments, rounding, etc.) and previous (prior year) balances.
If the trial balance is unbalanced, the Out of balance ( ) indicator displays at the top of the page. The amount by which the data is out of balance also displays at the top.
You can sort the data in each column in an ascending order or a descending order by selecting the column. An upward arrow ( ) or a downward arrow (
 ) displays on the page to indicate whether the data is sorted in ascending or descending order.
You can use the Rows per page dropdown to choose how many data rows to display on each page. The default is 100 rows.
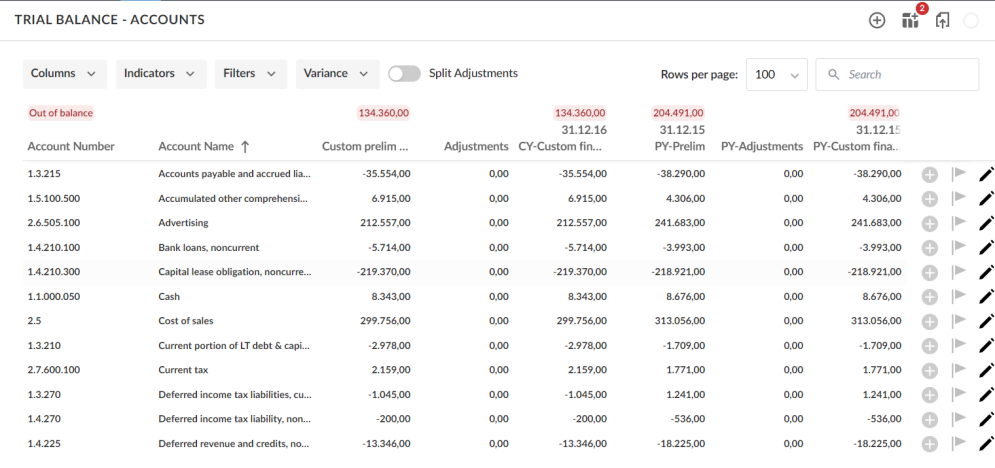
The drop-downs at the top of the Accounts tab allow you to include more columns or indicators in the page and filter the data.
To view additional data in the Accounts tab:
-
Select the Columns drop-down.
A list of the available columns displays.
-
Select the check box next to the column you want to view.
Available options include:
- Variance
- Variance percentage
- Area
- Cycle
- Tax adjustments
- Tax code
To include additional indicators in the Accounts tab:
-
Select the Indicators drop-down.
A list of the available indicators displays.
-
Select the check box next to the indicator you want to view.
Available options include:
- Issues
- Annotations
- Materiality
You can also search the page by entering keywords in the Search field at the top. Matching results are highlighted and displayed once you start typing.
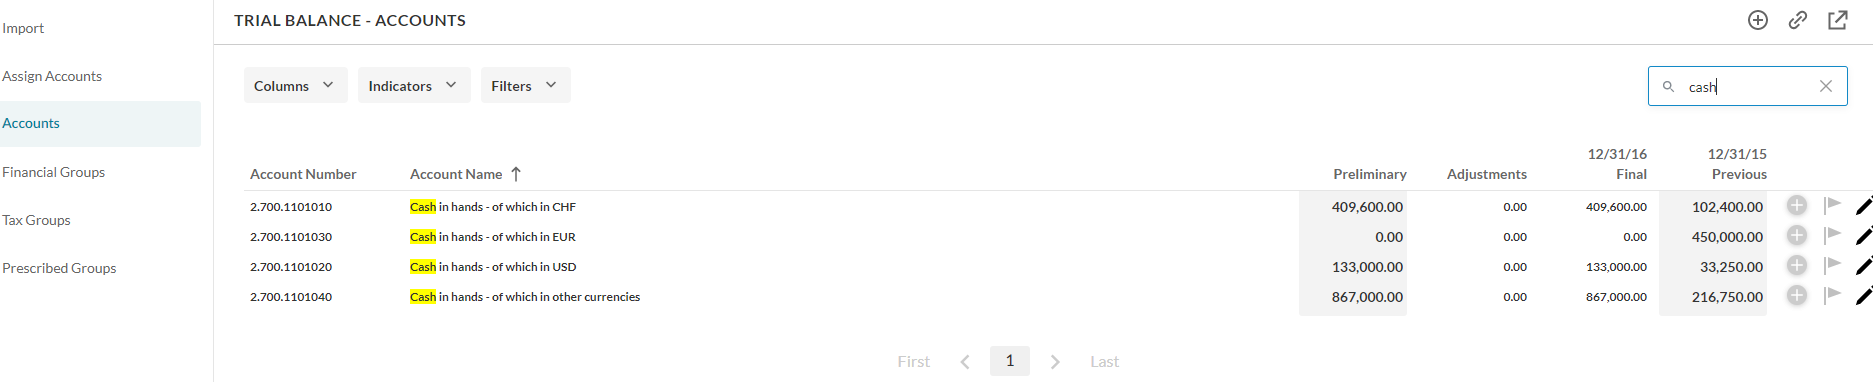
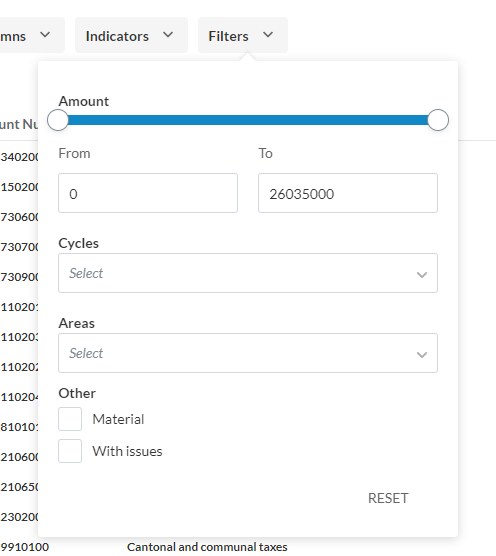
You can also filter the data on the page as desired. Select the Filters drop-down to specify a filter option:
-
At Amount, you can enter a range for the balances (From and To) so you only view account balances within that range. You can also use the slider to specify the range.
-
At the Cycles drop-down, you can filter the displayed accounts based on the selected cycle.
-
At the Areas drop-down, you can filter the displayed accounts based on the selected area.
-
You can select the Material check box to only display material accounts.
-
You can select the With issues check box to only display accounts with recorded issues.
You can also view transactions for each account. To learn more, see View account transactions.
View groups
In Caseware, financial grouping structures are containers that organize trial balance accounts for financial reporting, tax preparation, and regulatory filings. They work like a chart of accounts by mapping account numbers received from a client to a consistent set of groups.
Grouping structure vs. group
-
Financial grouping structure — A hierarchy of groups used to categorize and arrange accounts in the trial balance or financial statements.
-
Financial group (or group) — An item within a grouping structure, such as Revenue or Current Assets.
Available grouping structures appear as tabs in the left panel on the Data page. The primary structure is Financial Group, which the client's trial balance data is mapped into by default. Depending on your product template settings, you may also see secondary structures, such as Tax Grouping for tax categorization and Prescribed for regulatory or jurisdictional filings. Firm authors, enterprise authors, and end users can also be enabled to add and manage their own custom grouping structures.
Notice how group names display in blue while account names display in black.
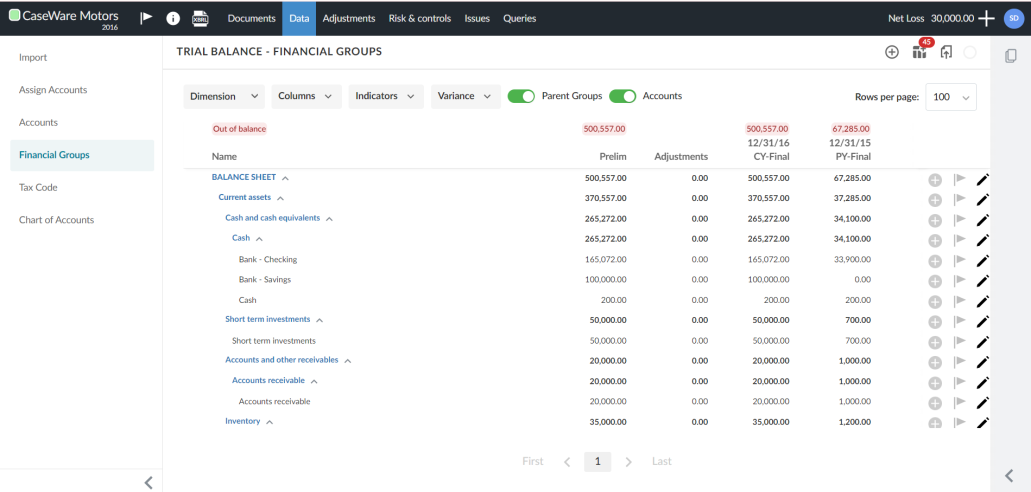
You can collapse and expand groups using the Collapse ( ) and Expand (
 ) icons. When all subgroups at the same level are collapsed, you can drag and drop them to rearrange them using the Rearrange (
 ) icon.
Filter groups by dimension
The Dimension drop-down at the top of each tab lets you filter the groups by dimension.
To filter the groups by dimension:
-
Select the Dimension drop-down. A list of the available dimensions displays.
-
Select the dimension you want to view.
You can also use the Search box to find the dimension in the list.
Show only groups
To hide the accounts and display groups only, disable the Accounts option:

Default groups and parent groups
The groups that show on the page by default are based on your product setup. If no default groups have been set up in your product, the page displays all groups in the hierarchy.
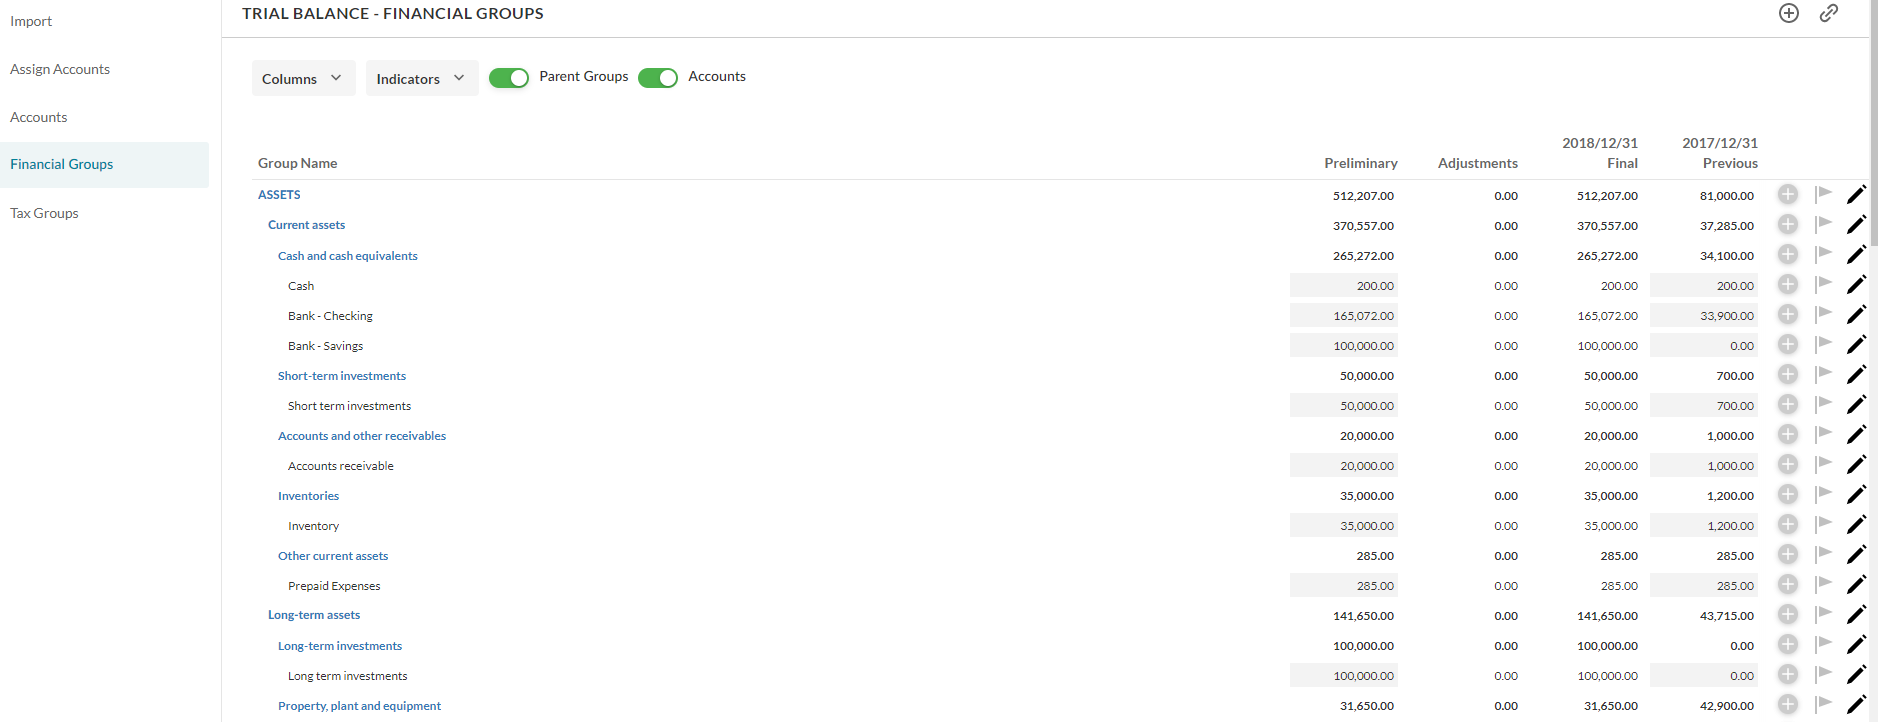
If you have default groups defined in your product, you can view the parent groups for the default groups by enabling the Parent Groups option.
For example, in the figure below, default groups have been set up in the product, so the page displays the following groups by default.
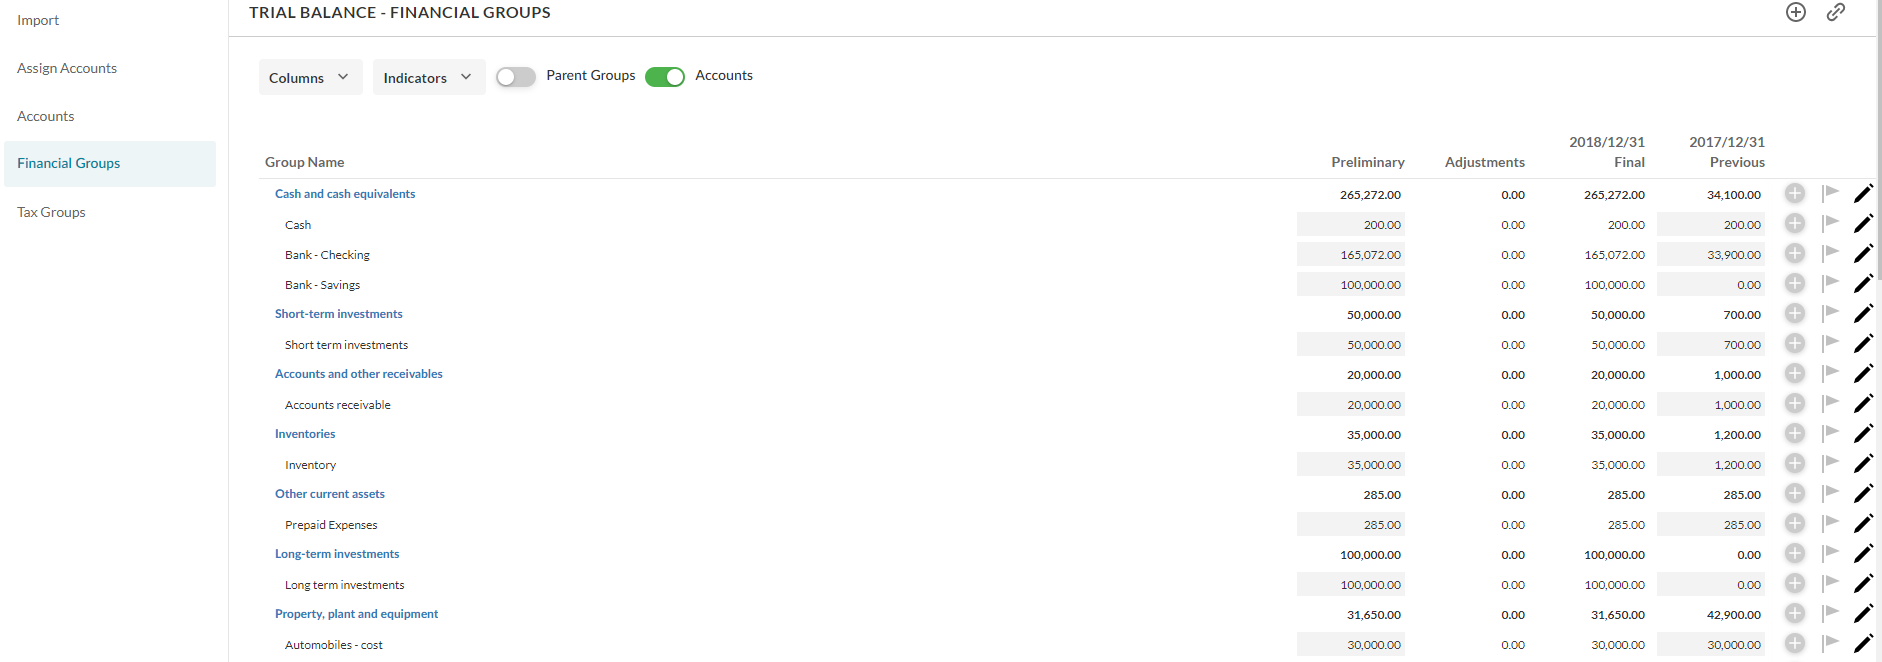
If you enable the Parent Groups option, the page displays all levels above the default group in the hierarchy (that is, the parent groups for each default group). Note that if no default groups are defined, enabling this option has no effect on the page.
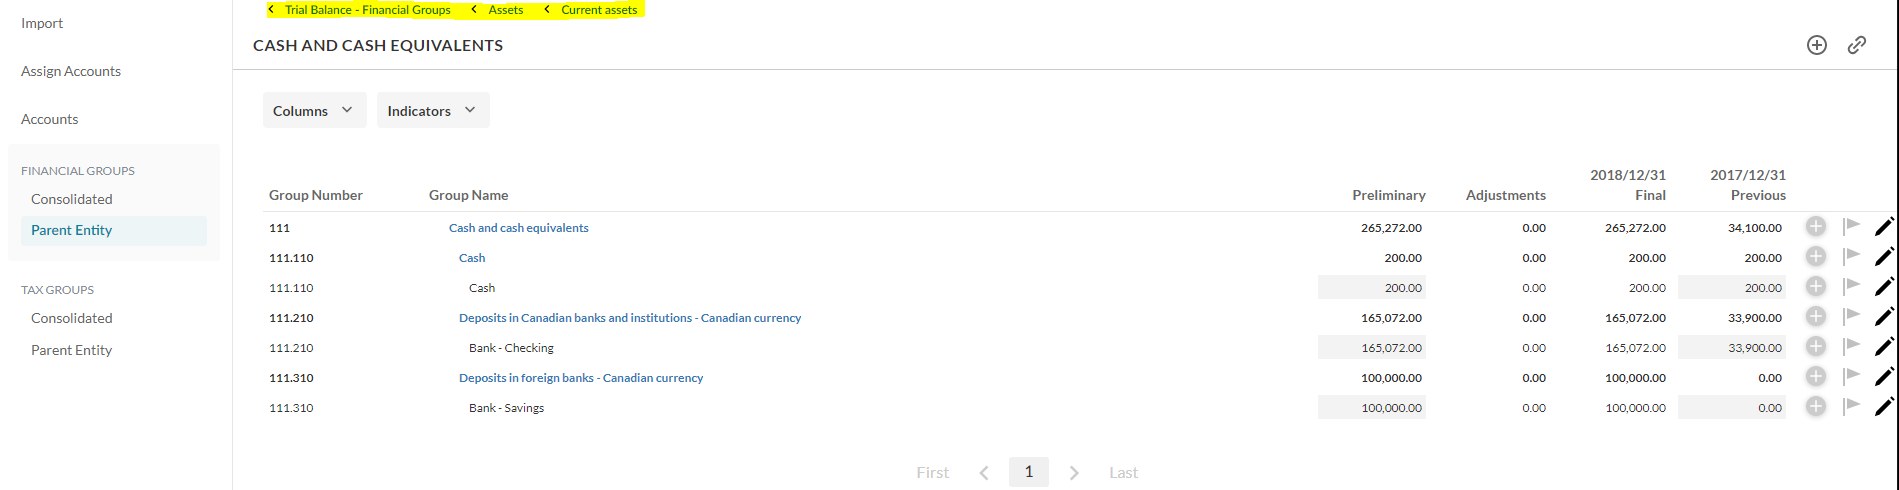
You can also select a specific group to view a drill-down of its subsequent groups on the page. For example, you can select Current assets to view its subsequent groups only. Notice how a navigation path displays at the top of the page so you can easily navigate to parent groups.
To learn more:
-
Financial grouping structures — Overview of grouping structures and how they work.
-
Customize financial groups — Add, edit, reorder, or delete groups within a structure.
-
Assign financial groups — Assign accounts to groups.
Customize how data displays
The following options apply to both the Accounts and the Grouping structure tabs.
-
If the trial balance is unbalanced, the Out of balance indicator appears at the top of the page. The amount by which the data is out of balance also appears at the top.
-
If your engagement doesn't close current-year net income to equity, the Out of balance message can appear on the Financial Groups window even when the trial balance is correct. You can change the out-of-balance check to use the full trial balance, including both Balance Sheet and Income Statement groupings. This prevents the false message.
You can use the Rows per page drop-down menu to choose how many data rows appear on each page. The default is 100 rows.
To learn more, see Financial grouping structures.
View additional columns
To view additional data in a tab:
-
Select the Columns drop-down. A list of the available columns displays.
-
Select the check box next to the column you want to view.
Available options include:
-
Variance
-
Variance percentage
-
Area
-
Cycle
-
Tax adjustments
-
Tax code
Control variance signs for credit and debit accounts
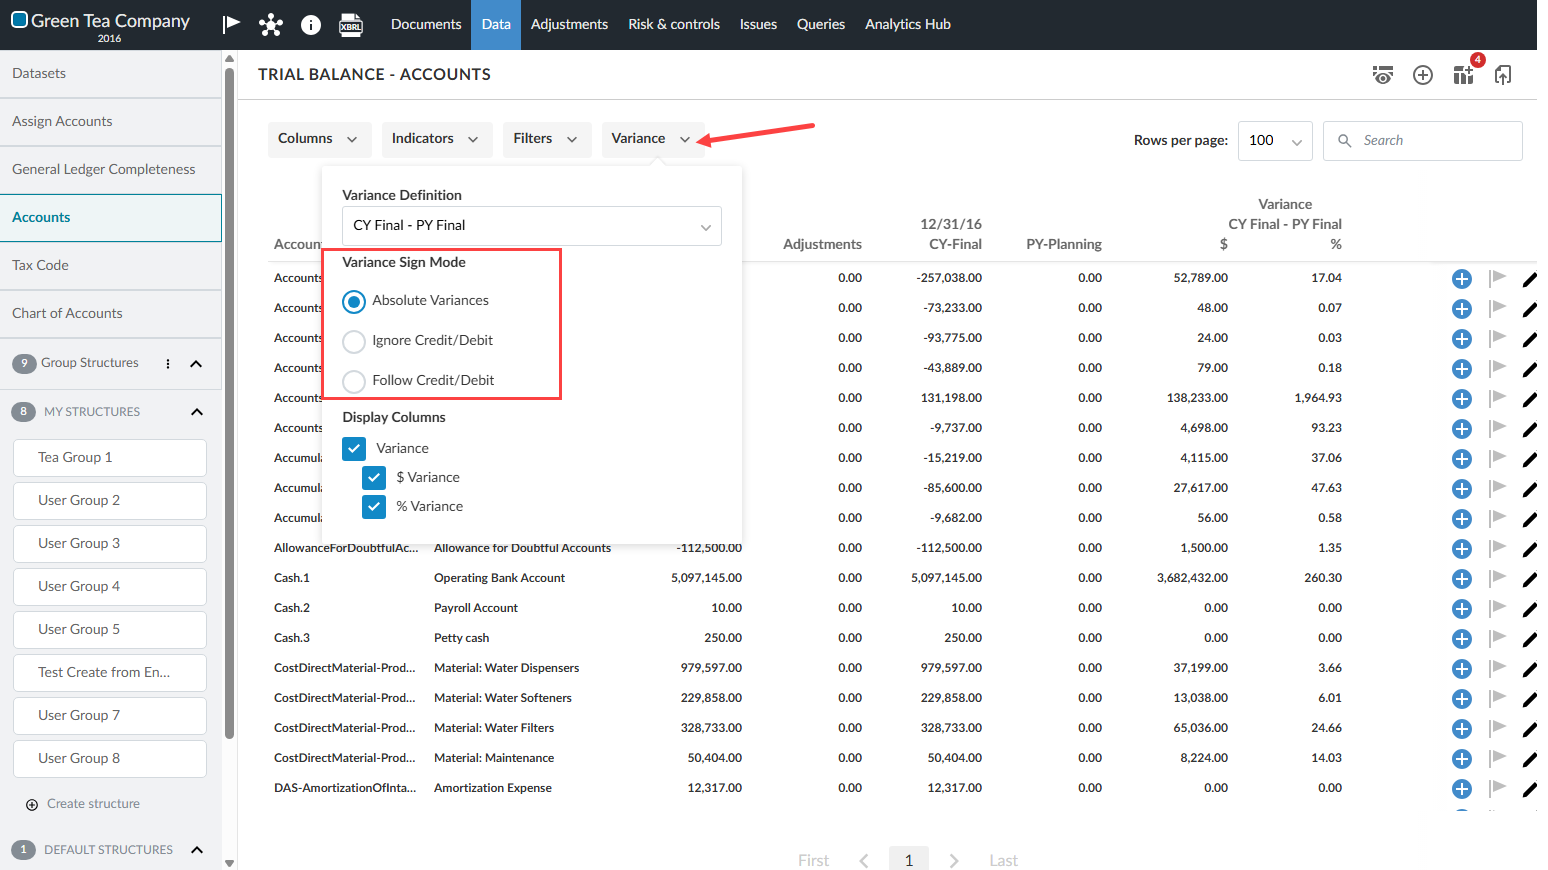
You can make the amount or percentage variance columns visible on the Data page. This allows you to control how positive and negative variance amounts appear for debit and credit accounts. By default, the system uses Ignore Credit/Debit behavior, which may cause some account increases to appear as negative variances for credit-balance accounts (such as liabilities, equity, and revenue).
To change the variance sign behavior, open the Variance dropdown list and choose one of the following options:
-
Absolute Variances — Variance amounts always display as positive.
-
Ignore Credit/Debit — Variance signs are calculated without considering whether an account normally carries a debit or credit balance. This is the default.
-
Follow Credit/Debit — Variance signs are adjusted based on the account's normal balance, so increases in credit-balance accounts display as positive.
Your selection is saved automatically and applies to exports, printing, and saved views.
Select variance sign options:
View additional indicators
To include additional indicators in a tab:
-
Select the Indicators drop-down. A list of the available indicators displays.
-
Select the check box next to the indicator you want to view.
Available options include:
-
Issues
-
Annotations
-
Materiality
View tax adjustment columns
By default, all tax adjustments accumulate into a single Tax adjustments column. If your product is set up to show separate tax adjustment columns, the Tax adjustments column is replaced by individual columns for each adjustment type, with incremental subtotals. This applies to the current year only.
The following columns display in place of Tax adjustments:
| Column | Displays |
|---|---|
| Tax - Federal |
Federal tax adjustments only |
| Tax Federal Final |
Final balances plus federal tax adjustments |
| Tax - State |
State tax adjustments only |
| Tax Federal + State Final |
Final balances plus federal and state tax adjustments |
| Tax - City |
City tax adjustments only |
The subtotal columns show the cumulative effect at each stage, which supports tax return preparation. These columns also appear in the CSV, PDF and Tabular Excel exports.
View adjustment details
If there are adjusting entries posted for specific groups or accounts, you can directly navigate from the Data page to the Adjustments page, where you can view the details of each adjusting entry.
If the Split Adjustments toggle is available in your product, you can turn it on to view normal and reclassifying adjustments in separate columns.
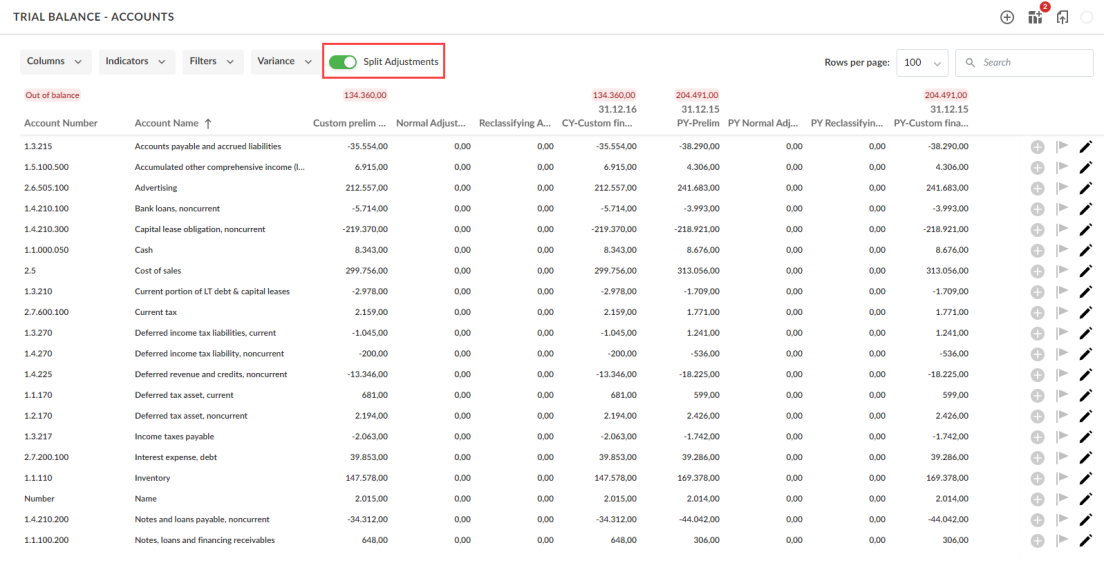
To view the details of an adjustment:
-
Go to the Adjustments column.
-
Select the adjustment you want to view its detail.
Adjustments display in a blue color.
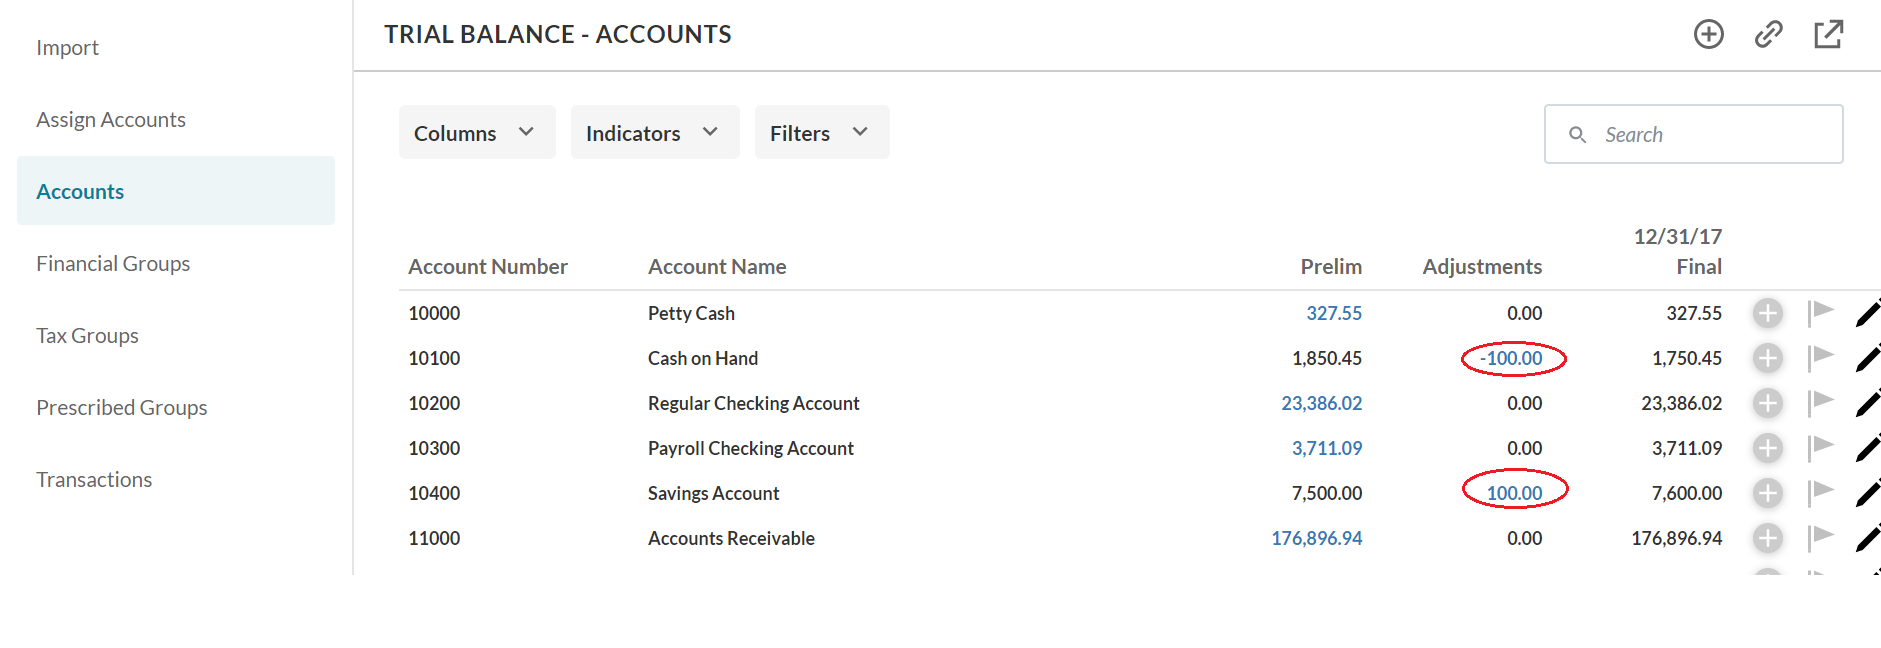
You are directed to the Adjustments page, where you can view the details of the selected adjusting entry.
Note: The selected adjusting entry is marked with a blue vertical bar on the left.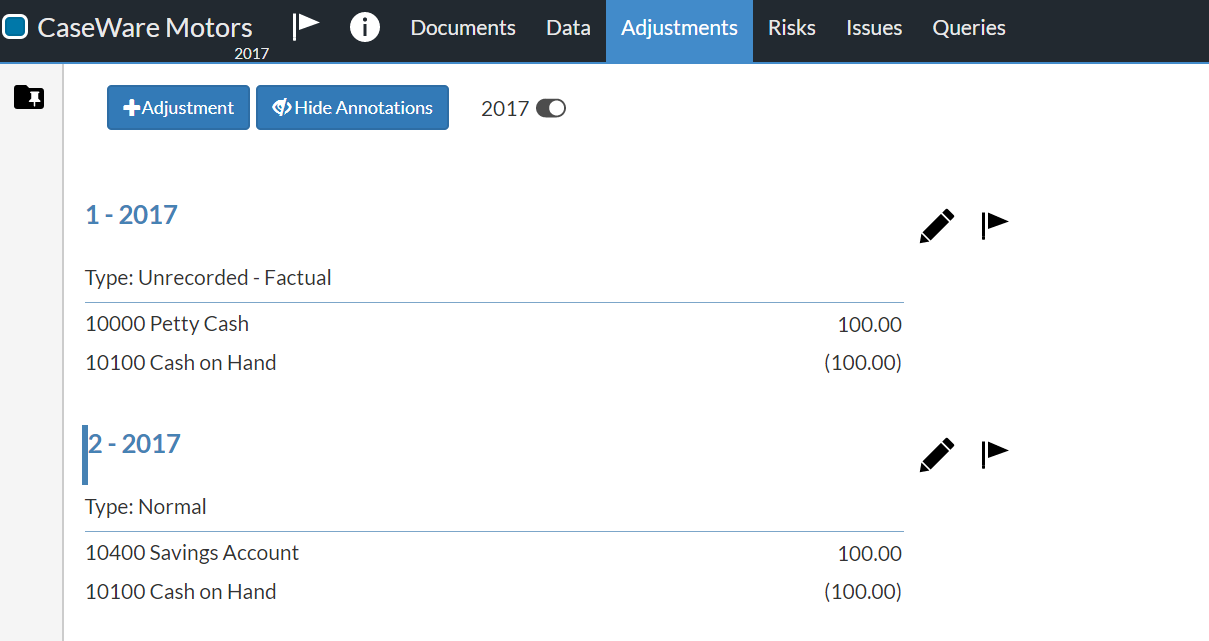
Save a view
If you've customized a view to display a specific set of data that you wish to revisit, you can save the view.
To save a view:
-
On the Data page, select the Save views icon (
 ).
). -
A list of previously saved views displays. Select Save current view.
-
Enter a name for the new view and select Save.
You can now select and manage your saved view from the list under the Save views icon ().