Manage analytic tests in the Analytics Hub
The Analytics Hub is a central location that you can use to view and manage all analytics tests available in your engagement. From the Analytics Hub, you can
-
View all analytic tests available in your engagement
Note: Tests linked to hidden checklist procedures are not shown in the Analytics Hub
-
View test statuses and results
-
Filter tests
-
Make adjustments to test configurations
-
Navigate to linked checklist procedures
To open the Analytics Hub, select Analytics Hub in the top menu. When you open the page, the list of all tests available in your engagement displays on the left. Tests are grouped under Journal Entry Relevance Ranking and No relevance ranking. You can search or use the filters to find the test you’re looking for.
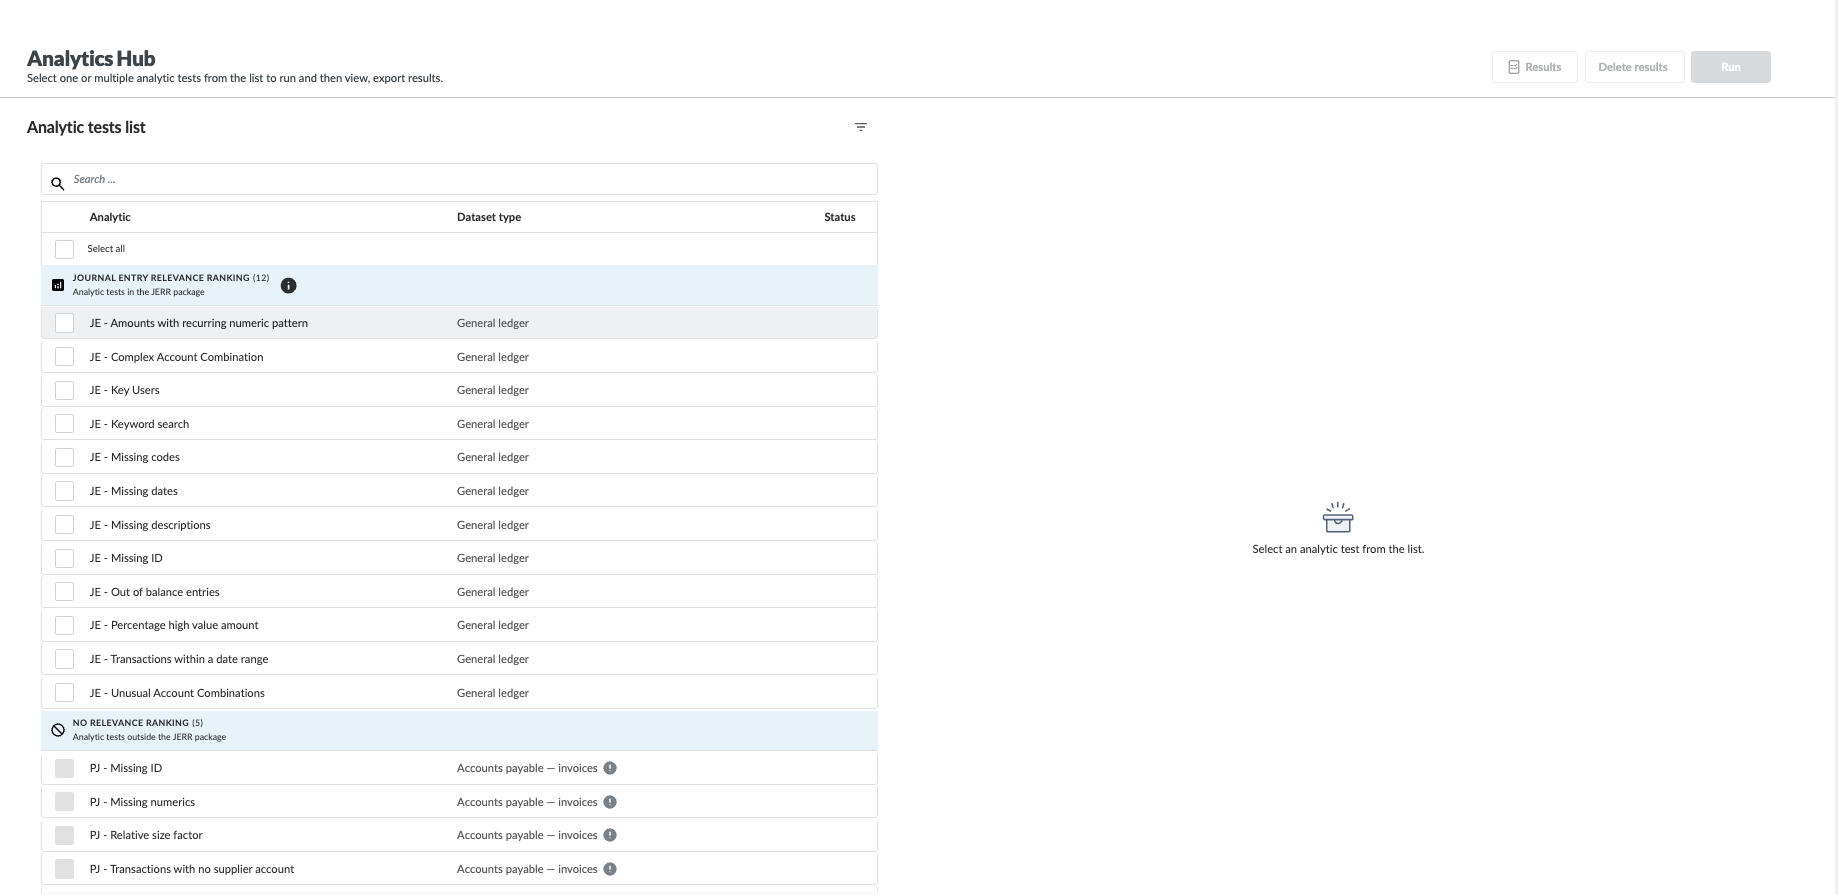
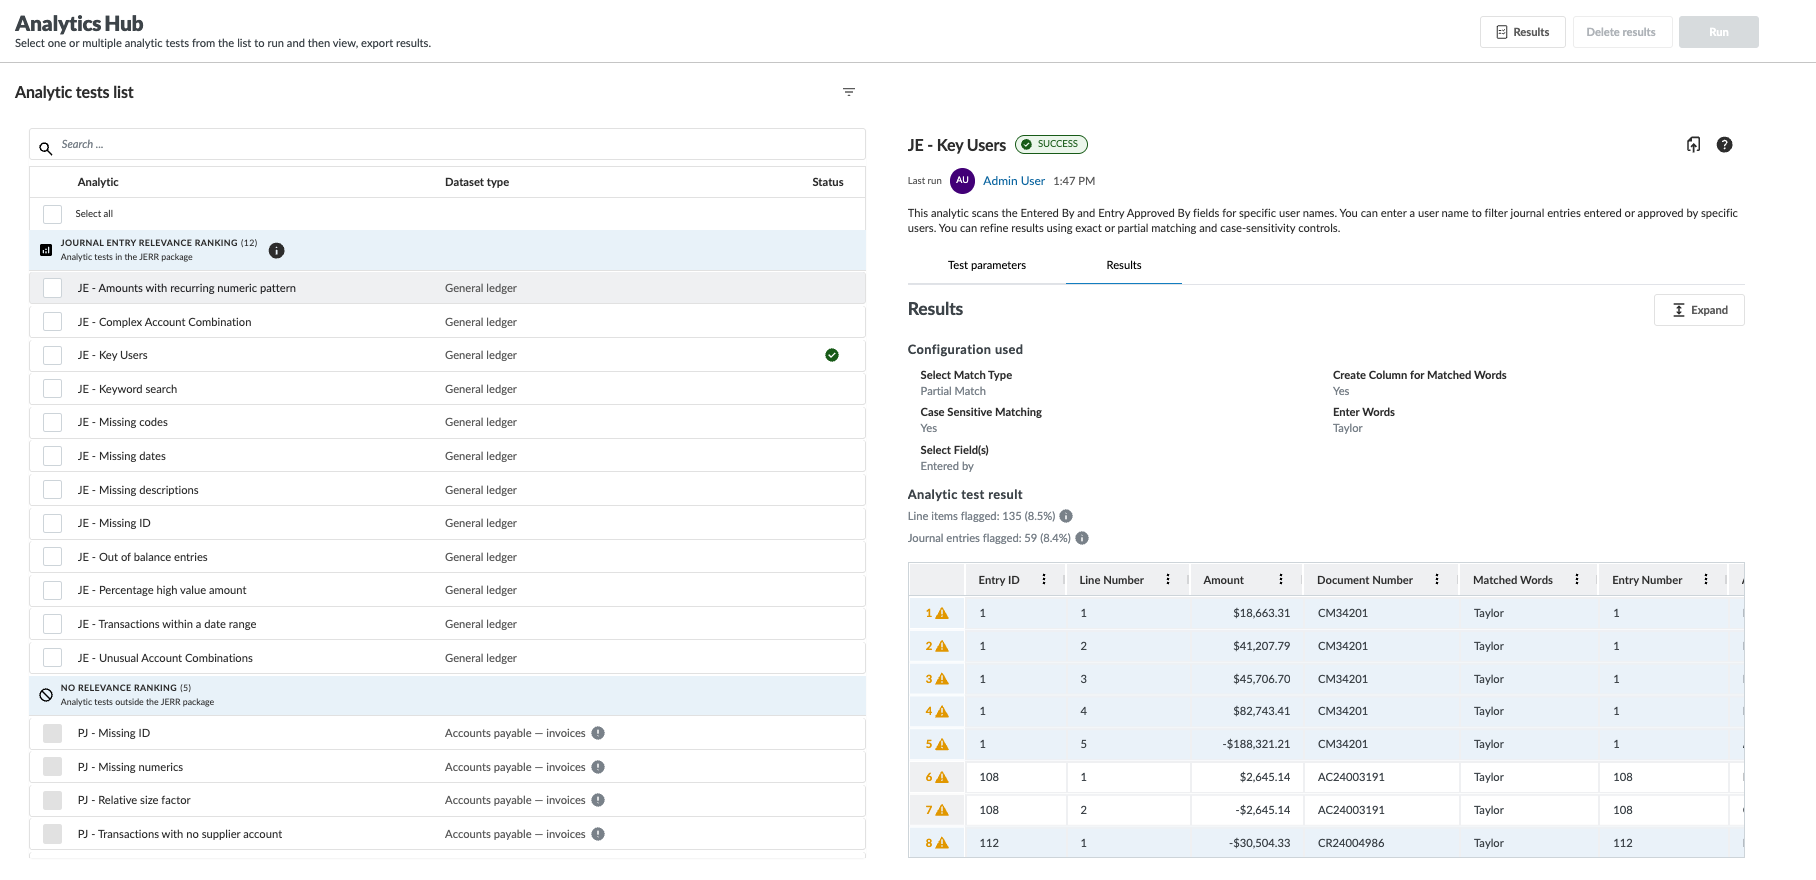
Once you open a test, you can adjust the configuration or navigate to the linked checklist procedures on the Test Parameters tab. To run the test, select the Run button and then view the results on the Results tab for the test. Note that you can also select multiple tests using the checkboxes and run them at the same time. This includes running Journal Entry Relevance Ranking (JERR) tests together with additional journal entry tests and sub-ledger analytics. Tests that do not contribute to the relevance ranking appear under No relevance ranking.
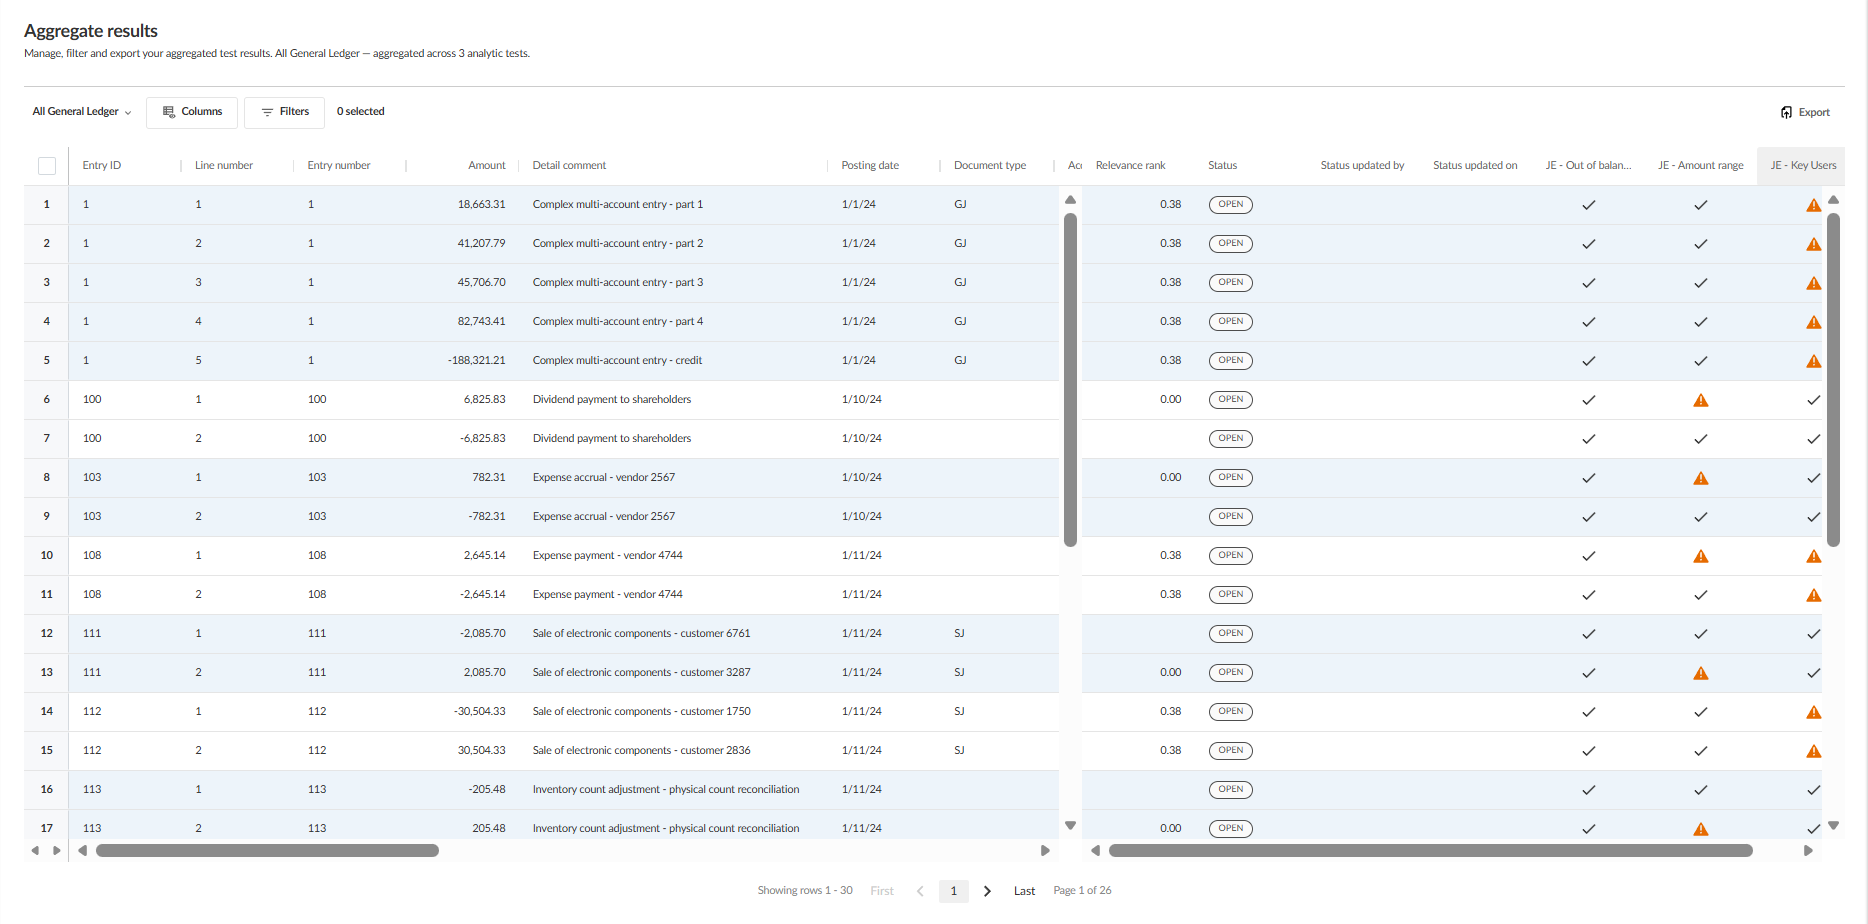
To open the Aggregated Results page, select the Results button at the top of the page. The Aggregated Results page displays all transactions flagged as a result of all tests that you have run. You can use the Columns and Filters options to filter the results you see and use the Export button to export the results to a CSV file.
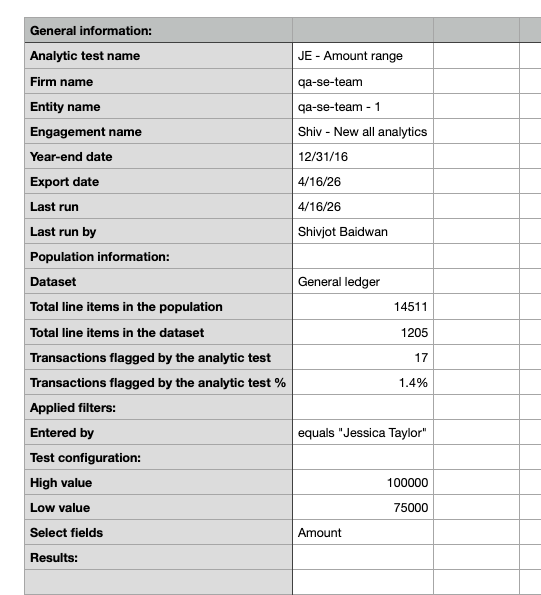
Exported analytic results include:
-
Metadata fields that describe the analytic run and dataset. Recent updates include:
-
A new Last run field showing the date of the most recent analytic execution
-
Renamed fields such as Last run by and Export date for improved clarity
-
-
Filters applied to an analytic test, which help you review, explain, and decide whether you need to run the test again
-
Summary metrics in export metadata, including:
-
Total line items in dataset
-
Total line items in population
-
Line items flagged by analytic test
-
Flagged line items (%)
-
These details help you understand how results were generated and assess the significance of flagged items without additional calculations.
Total line items in the dataset, total line items in the population (if filters applied), number and percentage of line items flagged by analytics can also be viewed from the Results tab.
Flagged Journal Entries View
When journal entry view is enabled, results in the Analytics Hub display all line items belonging to the same journal entry, not just the flagged line item. This gives you the full context of an entry, including its purpose and financial impact.
View journals with flagged line items
You can view journals with flagged line items for any analytic test.
To view journal entry results:
-
Select Analytics Hub from the top menu.
When you open the page, the list of all tests available in your engagement displays on the left.
-
Select an analytic test. You can search or use the filters to find the test you're looking for.
-
Select Run at the top of the page.
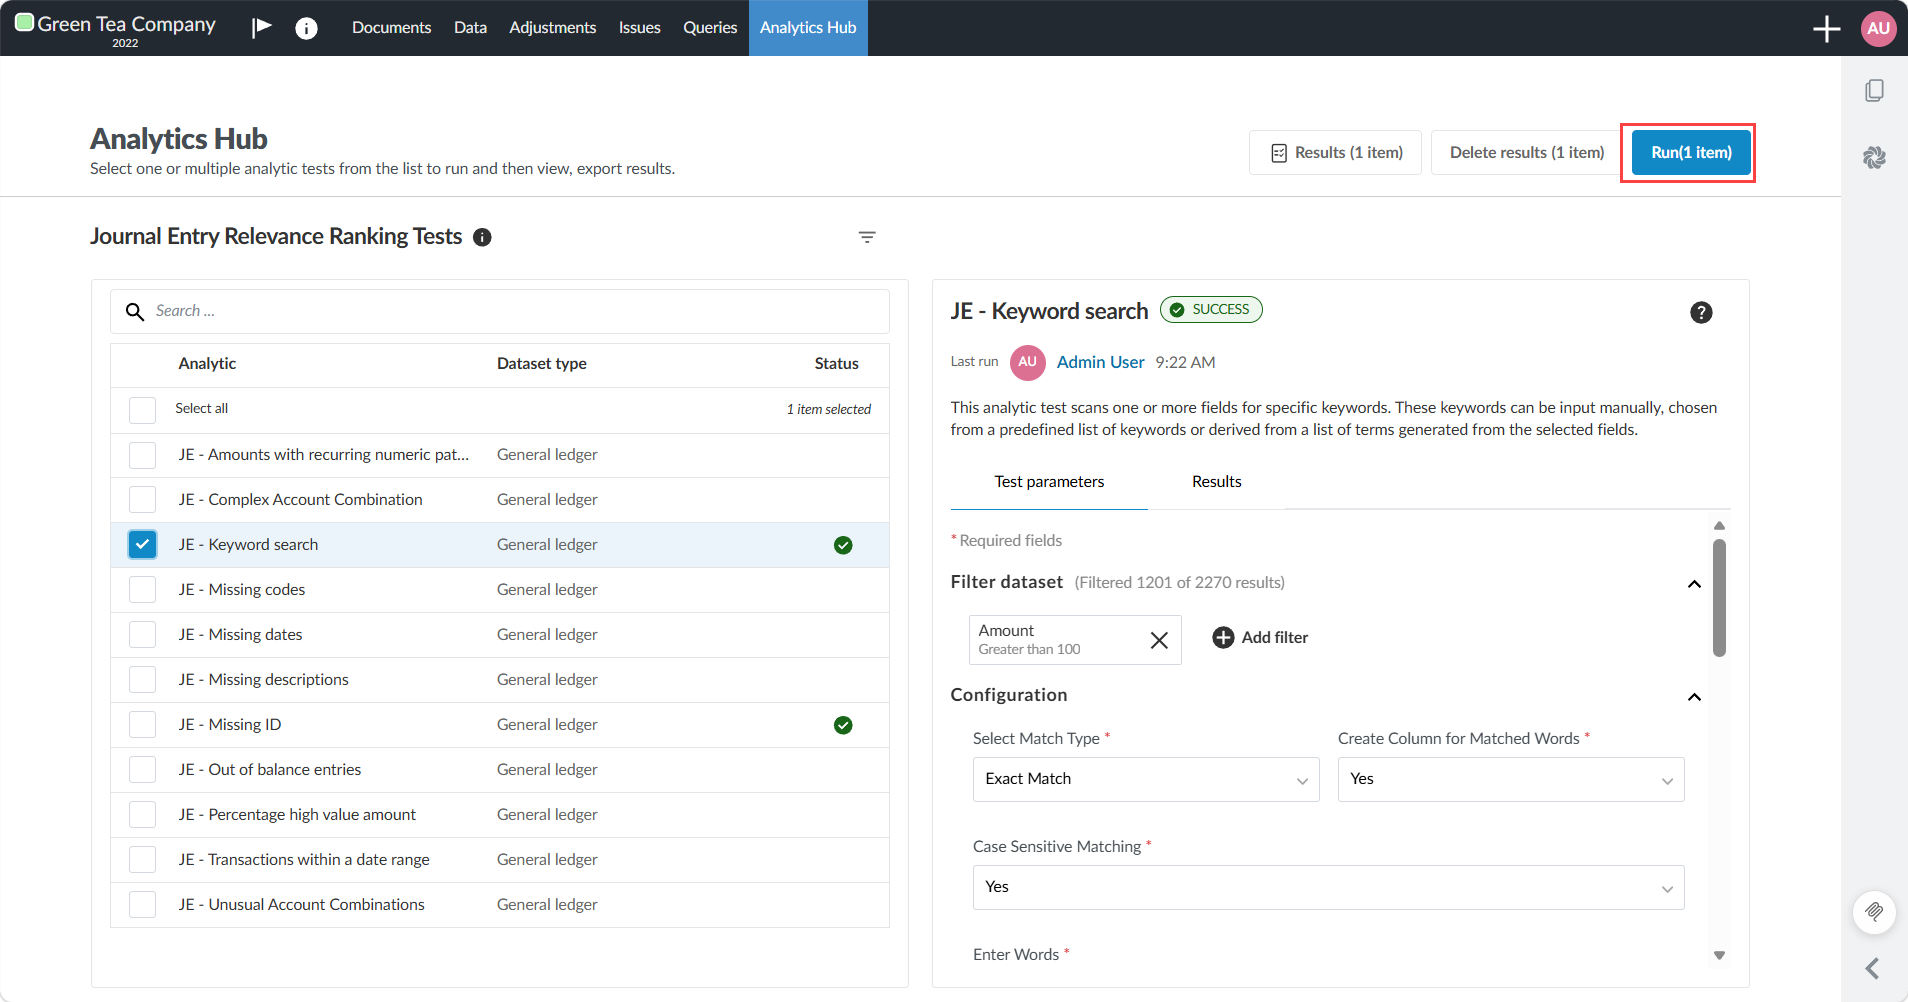
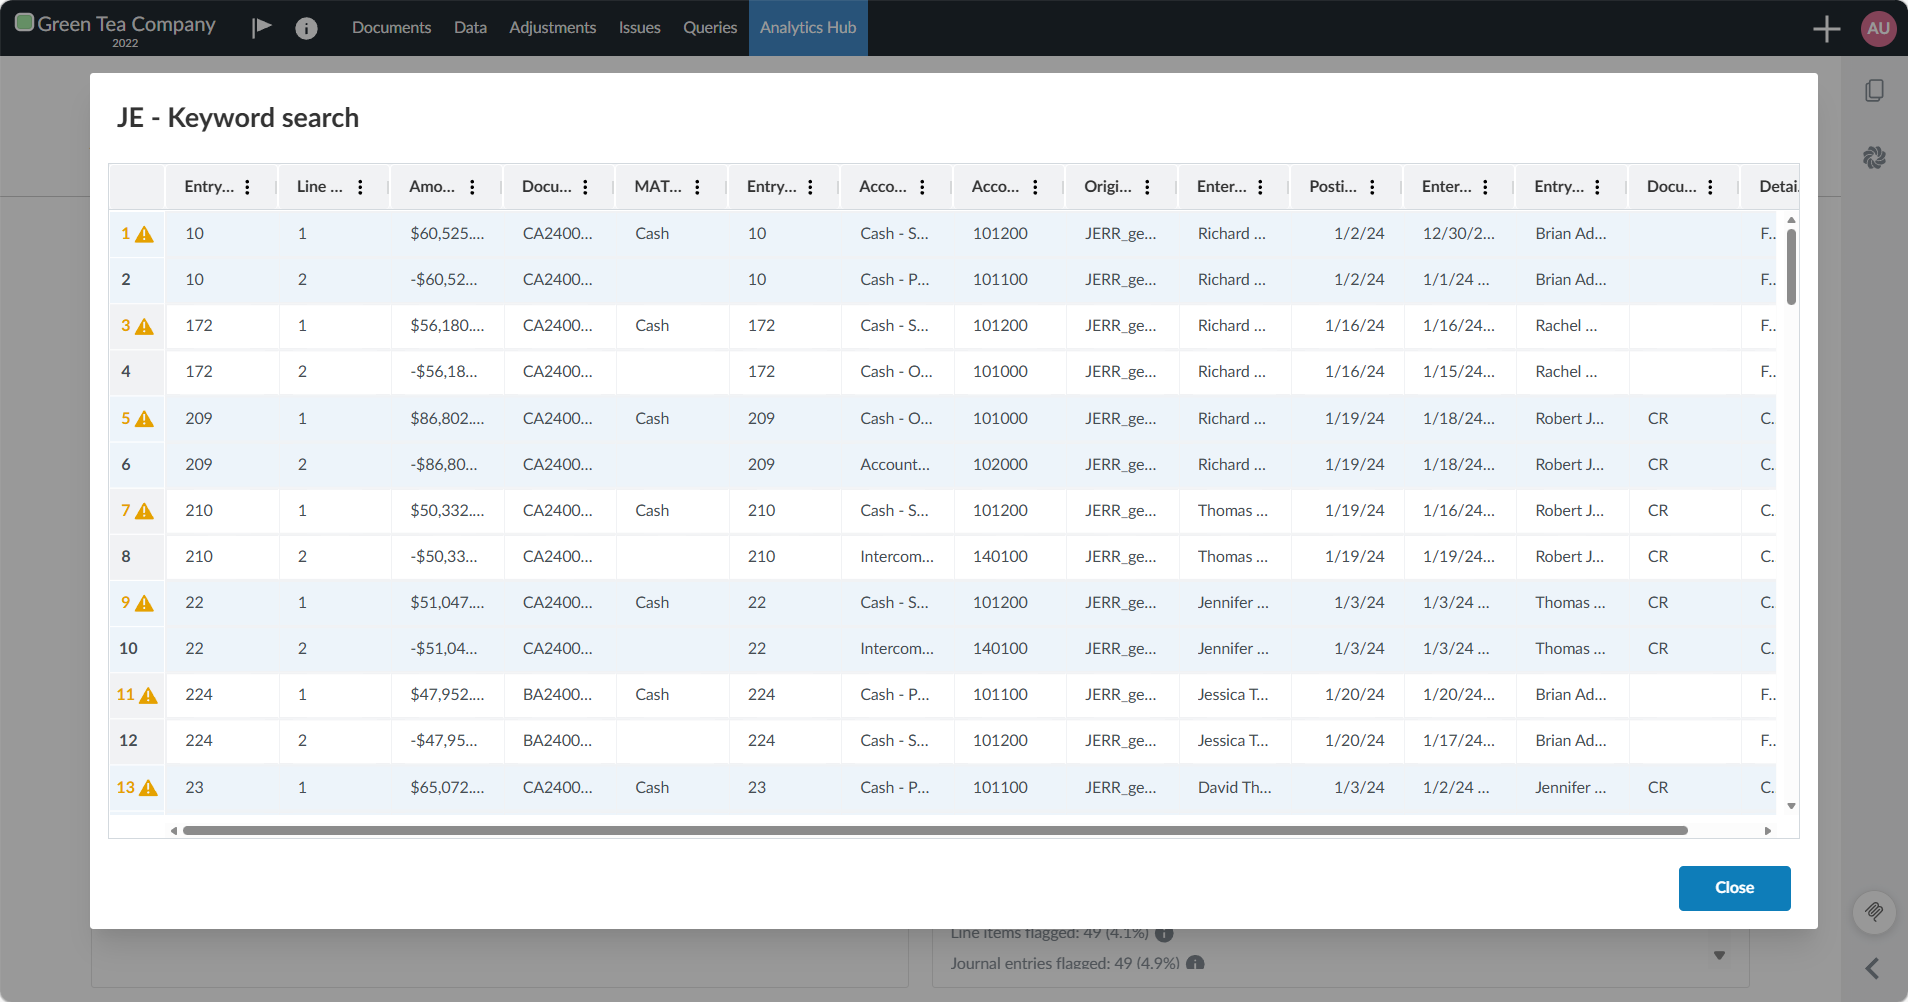
Results display grouped by journal entry in alternating colors for easy identification. Each group shows all line items associated with the same Entry ID. Flagged line items are indicated with a warning sign.
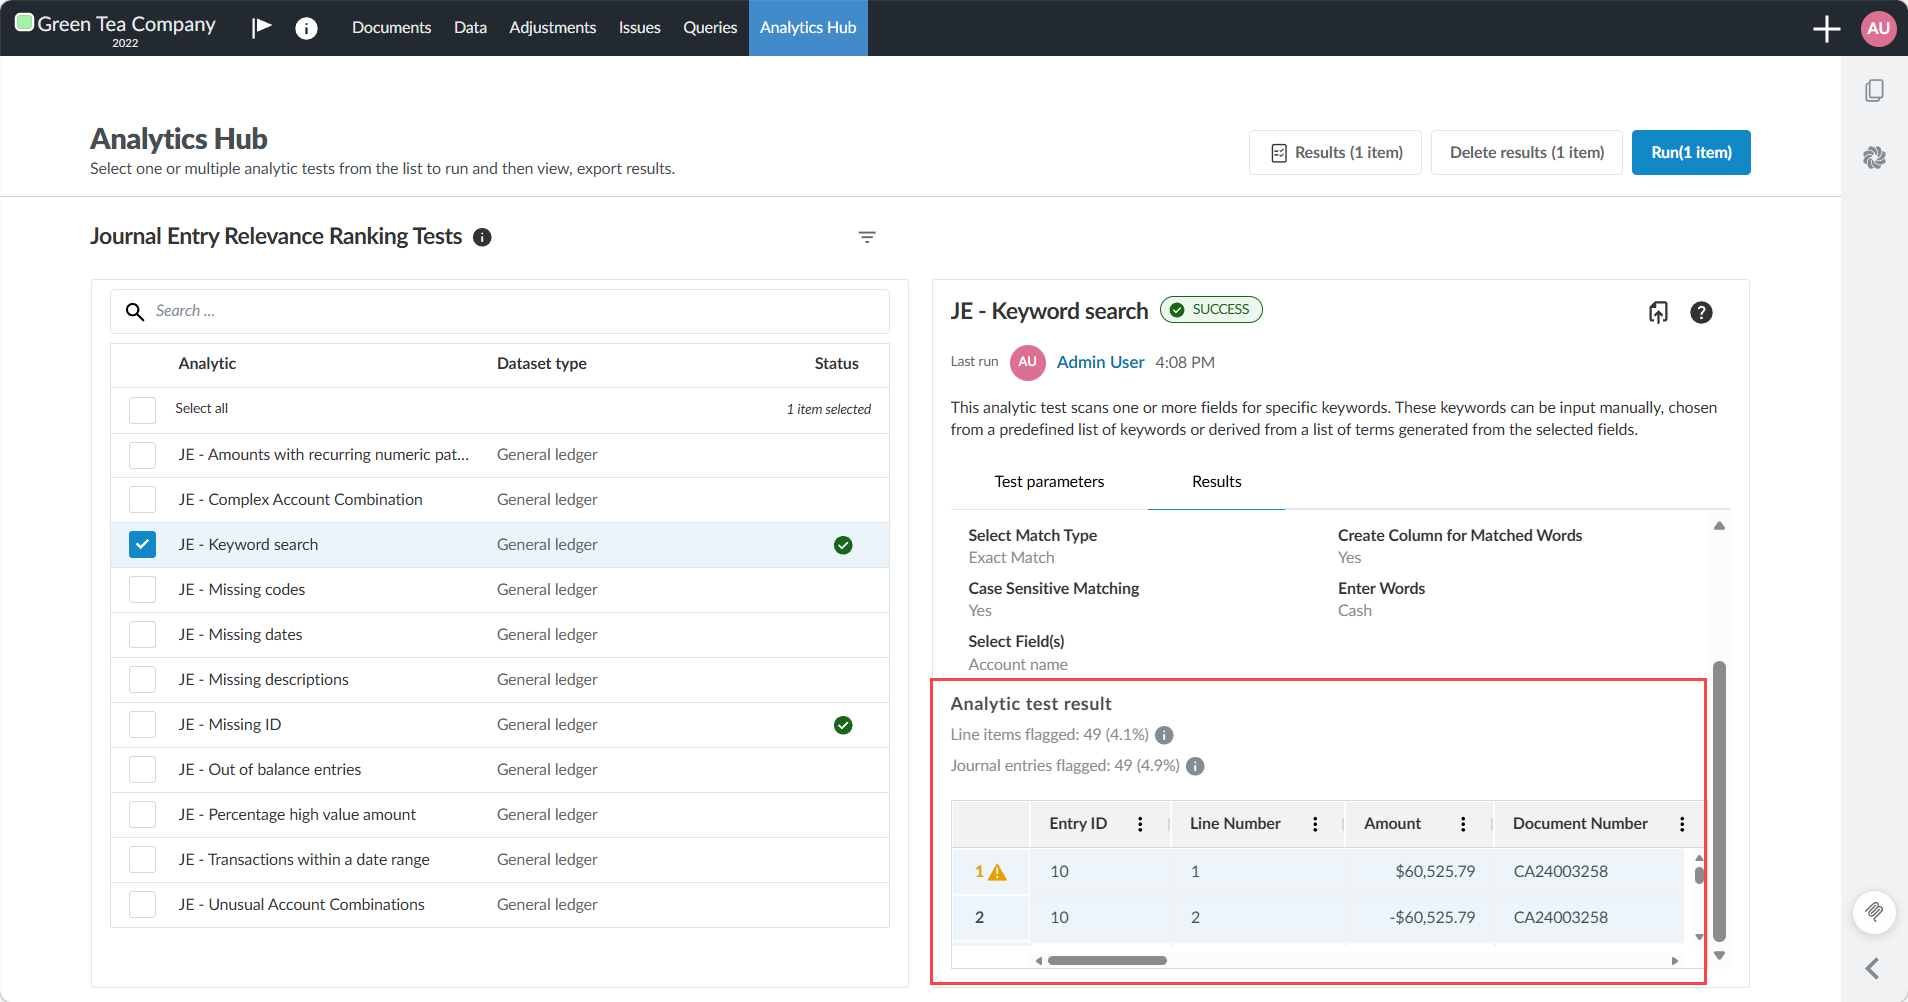
The Analytic test result section above the grid shows:
-
Line items flagged and percentage
-
Journal entries flagged and percentage
-
-
Select Expand to display the full results.
View aggregated results
When you select multiple analytic tests, you can view all results together in the aggregated results view.
To view the aggregated results:
-
Select Analytics Hub from the top menu.
-
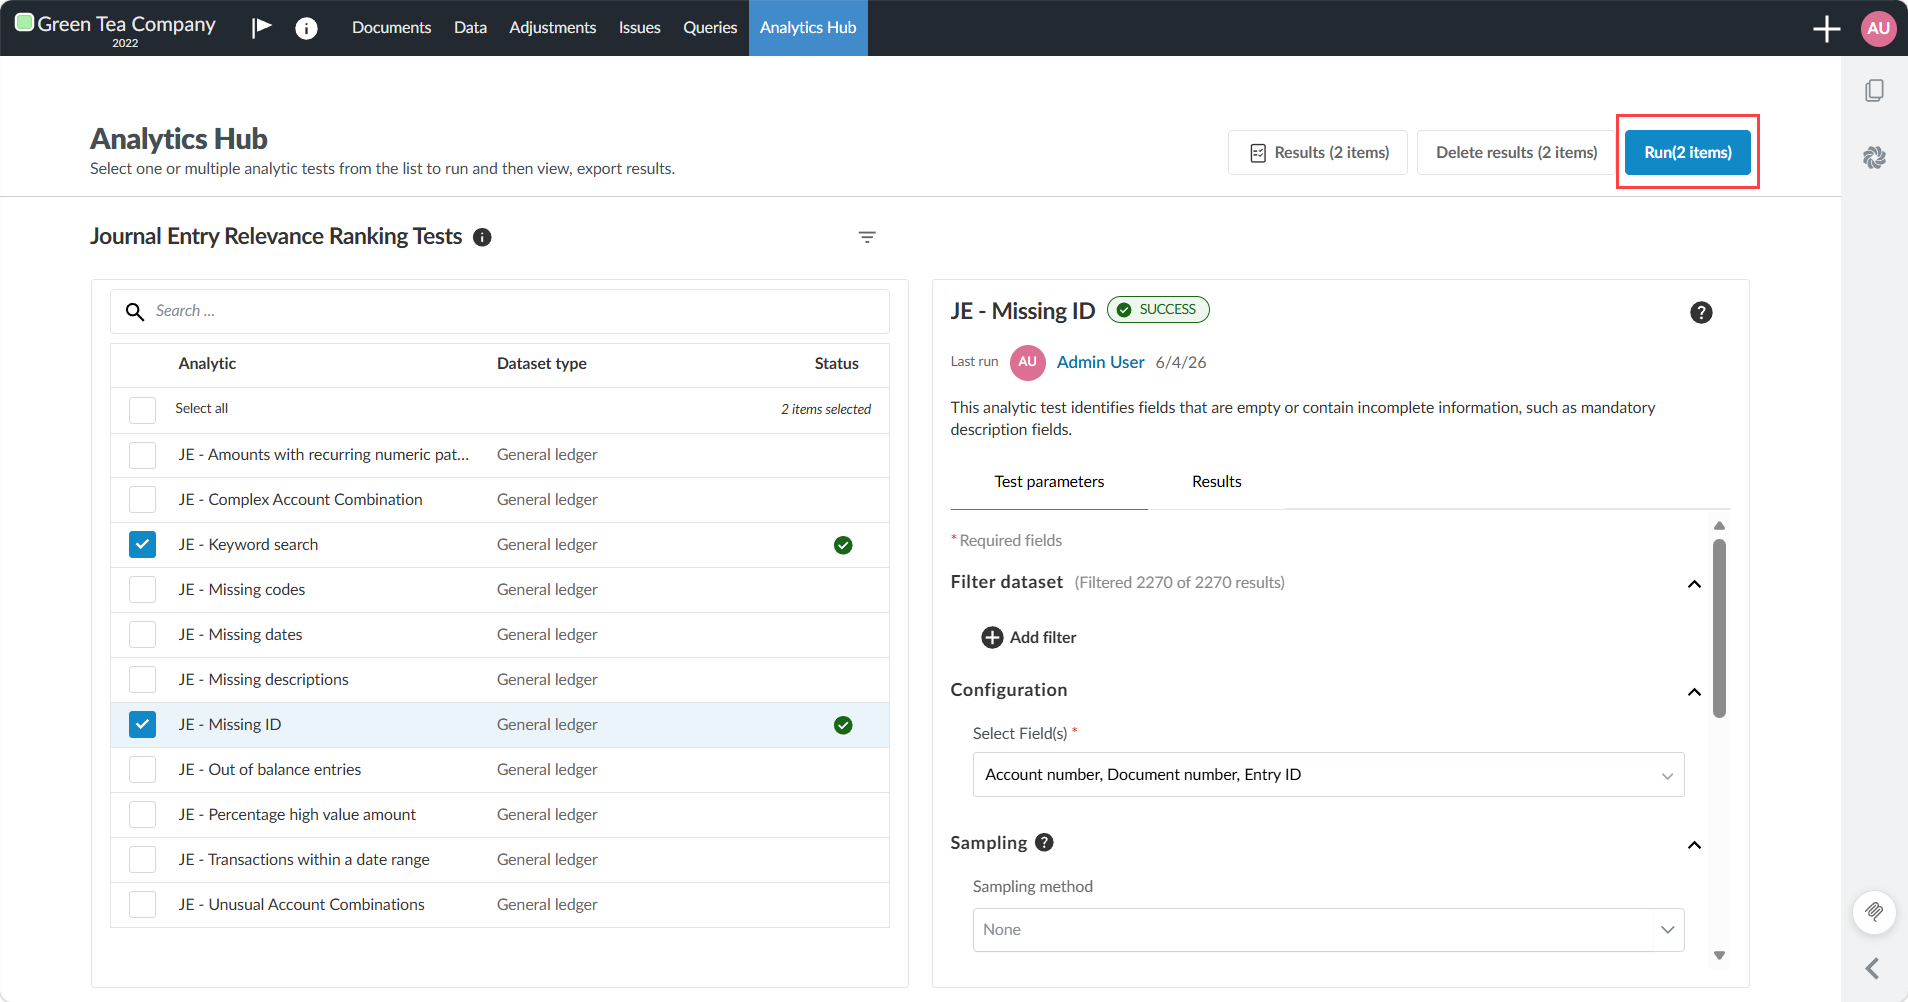
Select multiple analytic tests using the checkboxes. You can search or use the filters to find the test you're looking for.
-
Select the Run button at the top of the page. If you have already run the selected analytic tests, you do not need to run them again.
-
Select the Results tab to display the aggregated results.
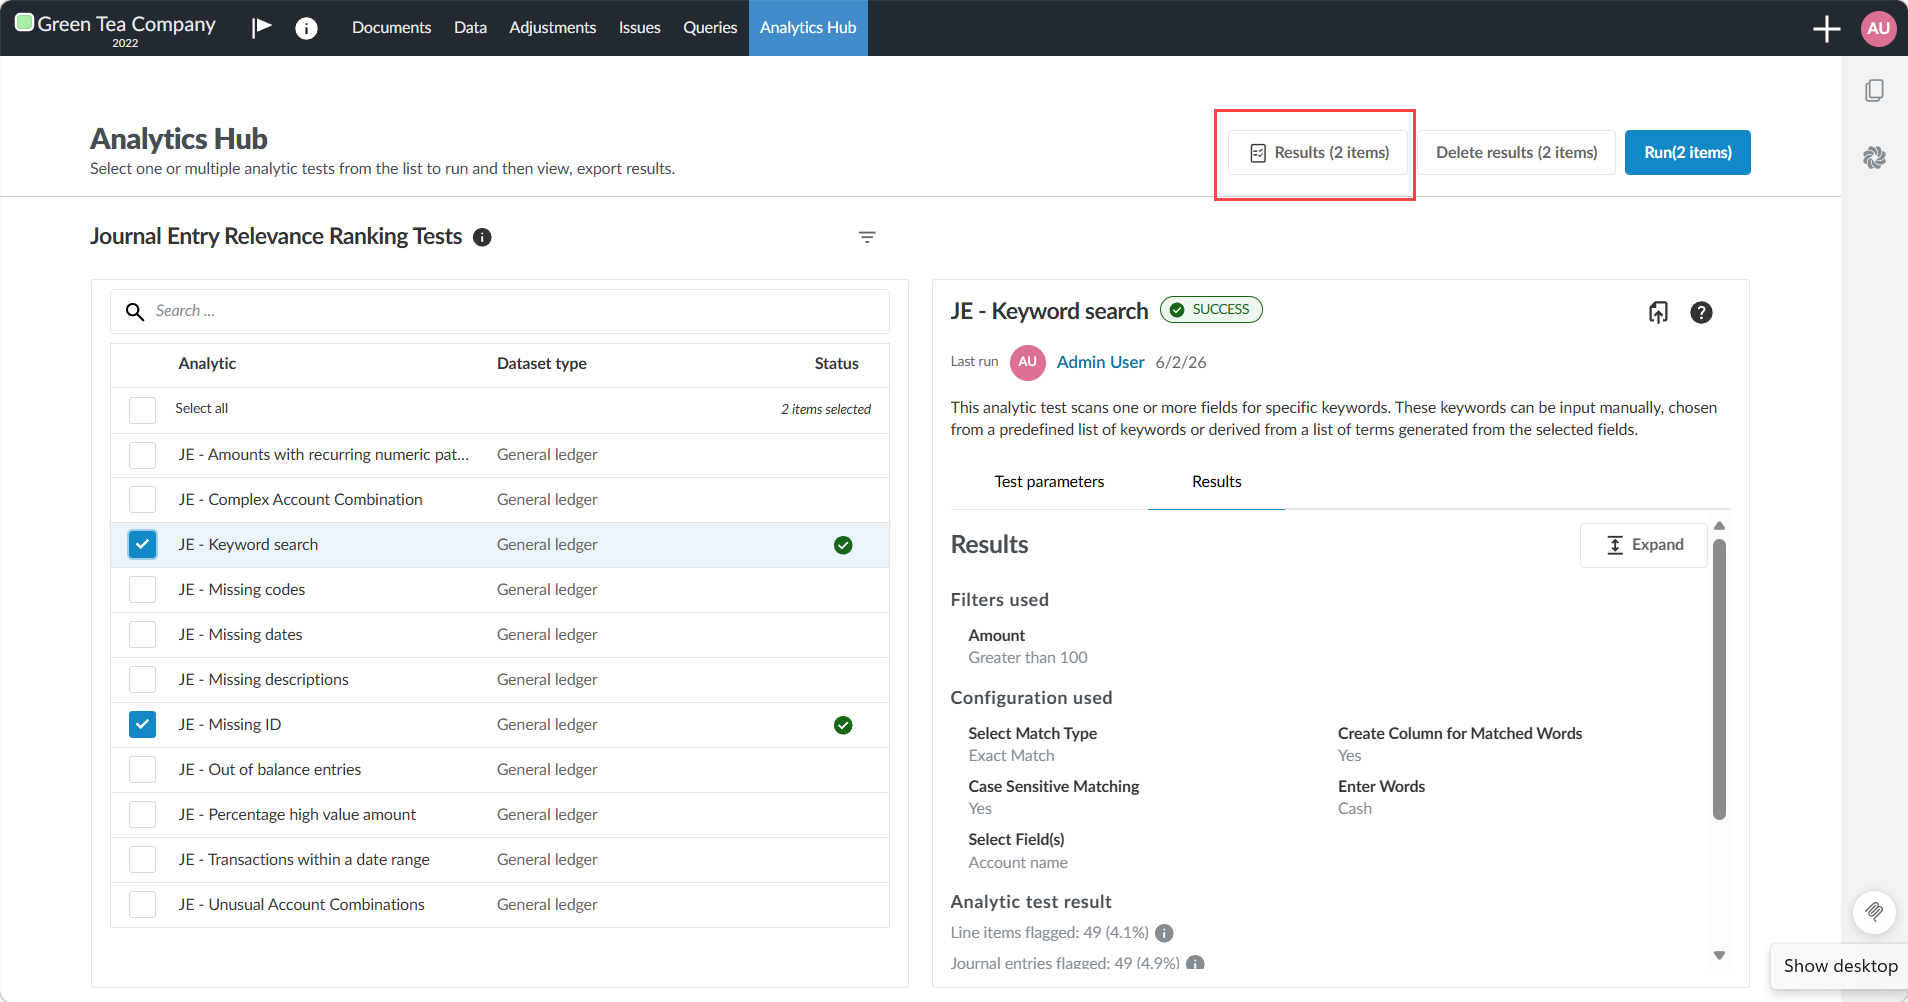
Results display grouped by journal entry with alternating colors. Unlike individual test results, flagged items are not indicated with a warning sign. Instead, each analytic test appears as a column showing whether the entry was flagged or passed. What the Relevance rank column shows depends on the view you select on the Aggregated results page. When you select JE - Relevance Rank view, only the Journal Entry Relevance Ranking tests appear, which all have a relevance rank.
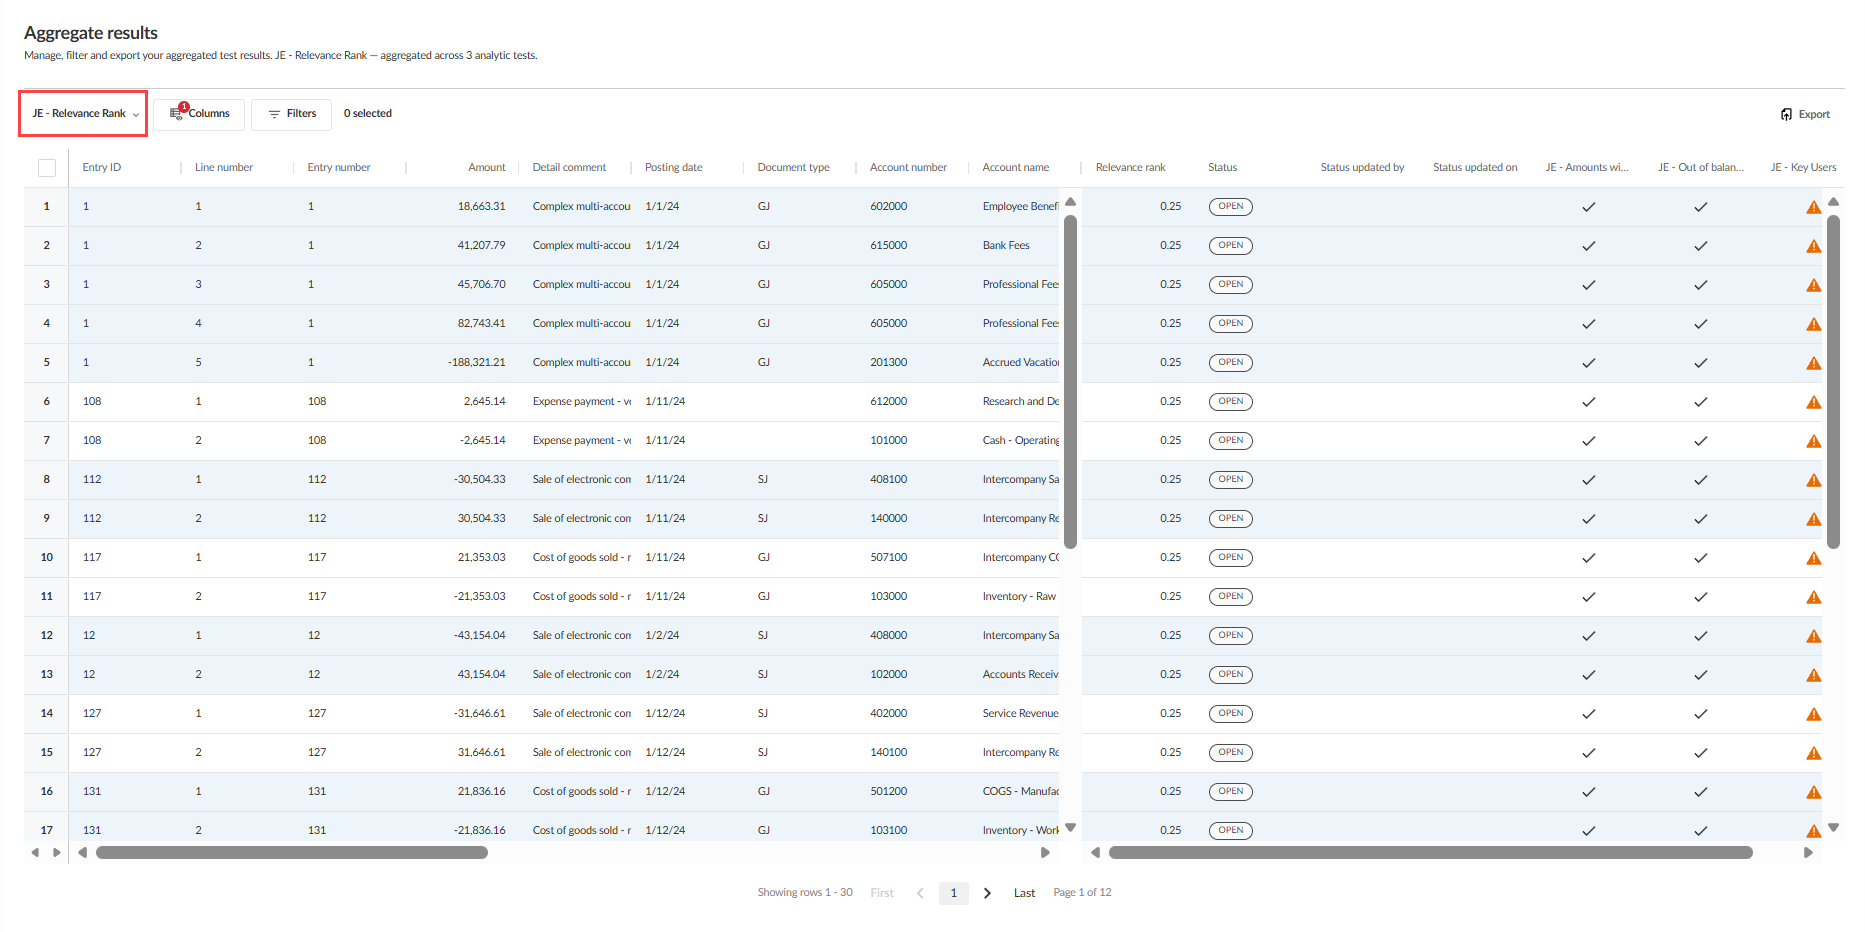
When you select All General Ledger view, additional journal entry tests also appear as columns, but they do not contribute to or change the relevance ranking.
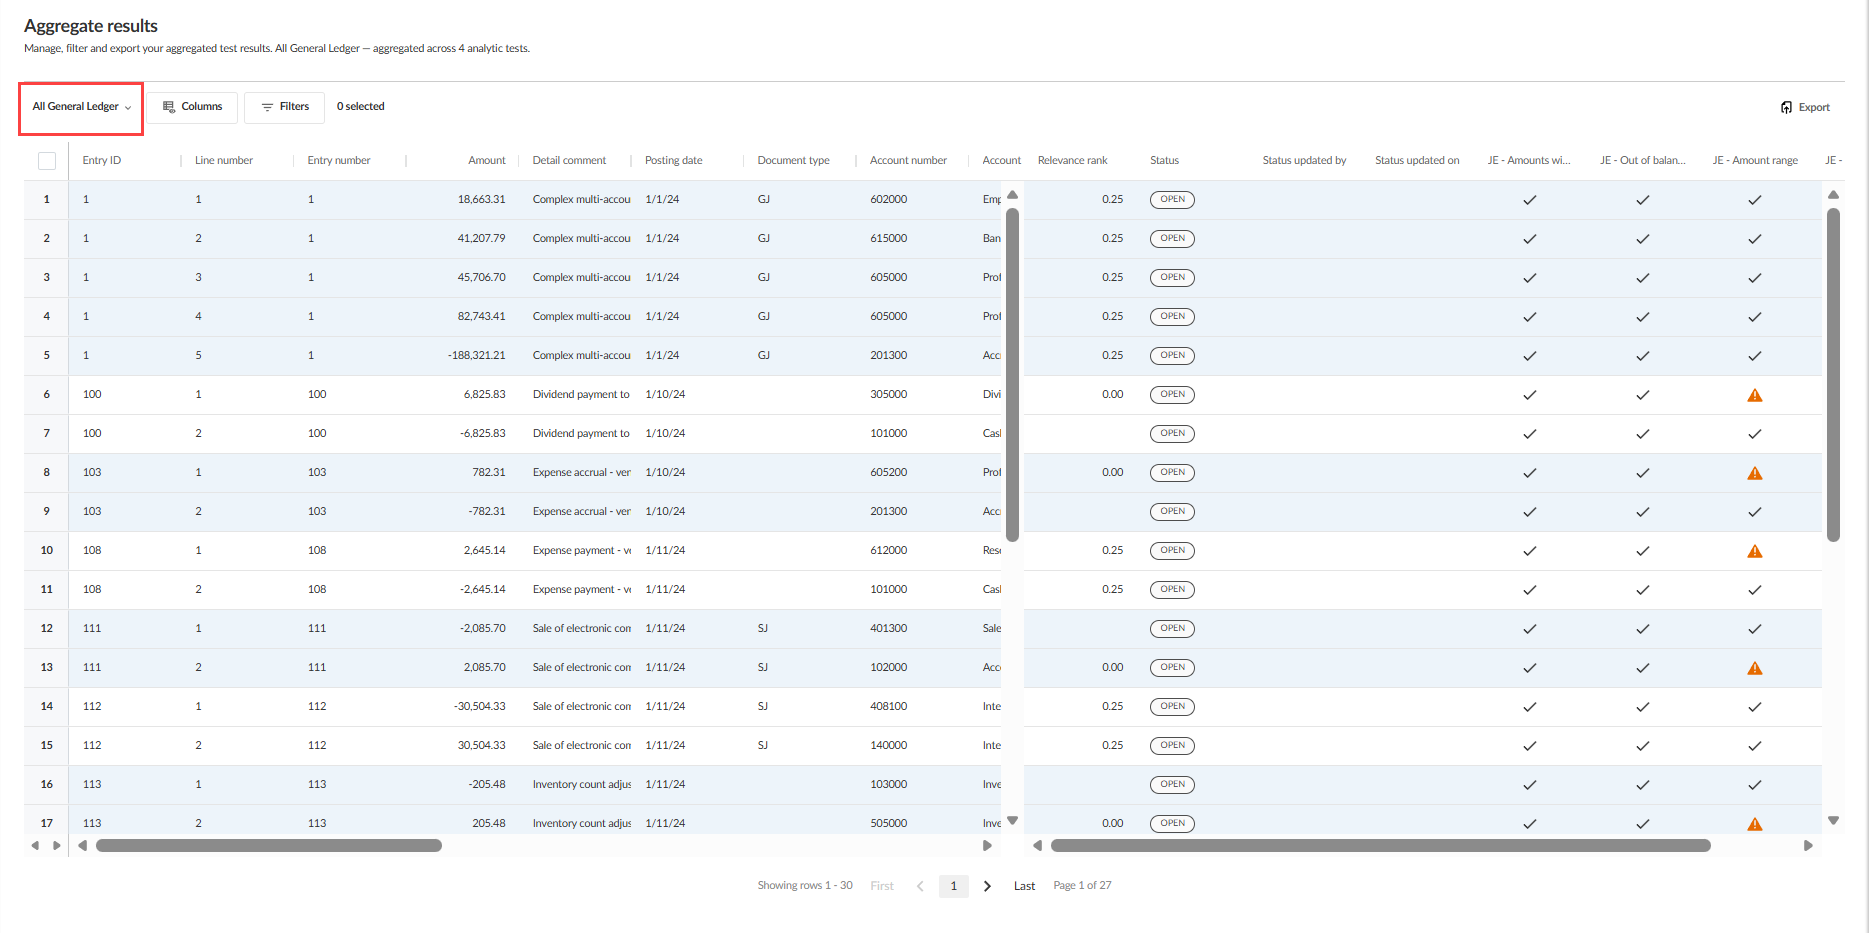
The General Ledger view and each subledger remain unchanged and do not include a relevance rank. Results are sorted by the Relevance rank column, with the most relevant journal entries first. You can use the Columns and Filters options to filter the results you see.
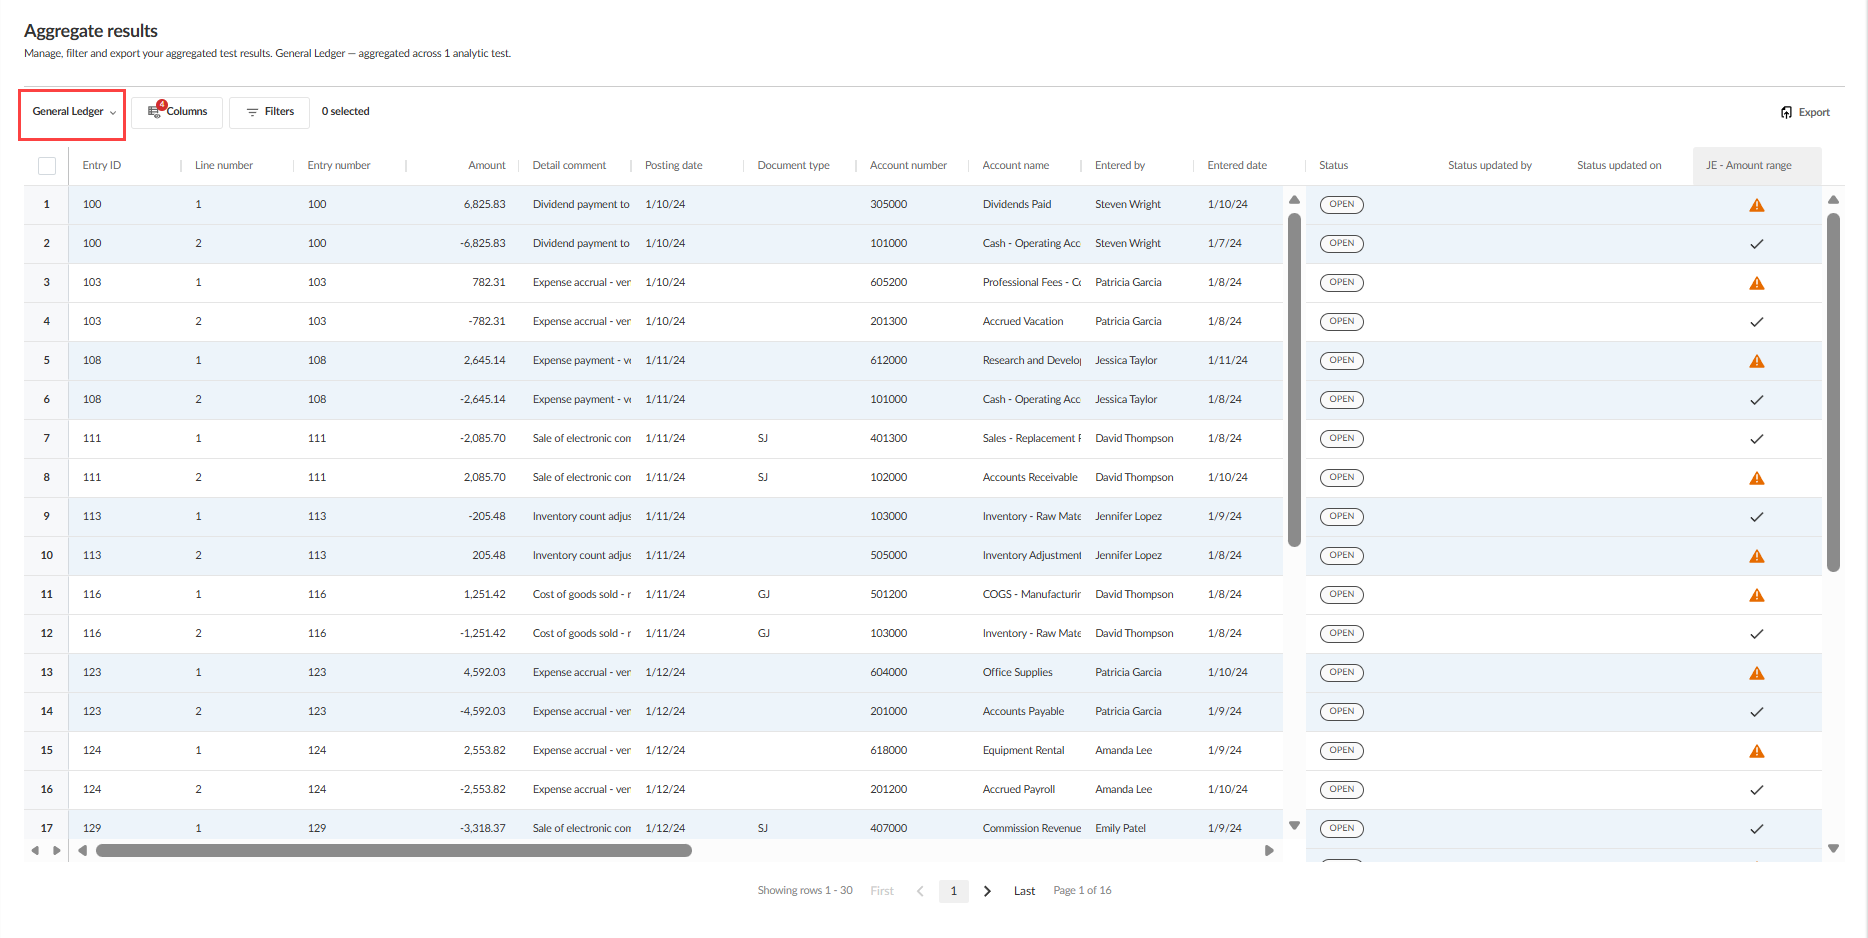
Export journal entry results
Select the Export button to export results to a CSV file. The export metadata includes journal entry flagging information in addition to line item counts. If filters are applied, the export metadata reflects the filtered population.
The export metadata includes:
-
Total line entries in the dataset
-
Total line items in the population
-
Entries flagged by analytic test
-
Flagged entries (%)
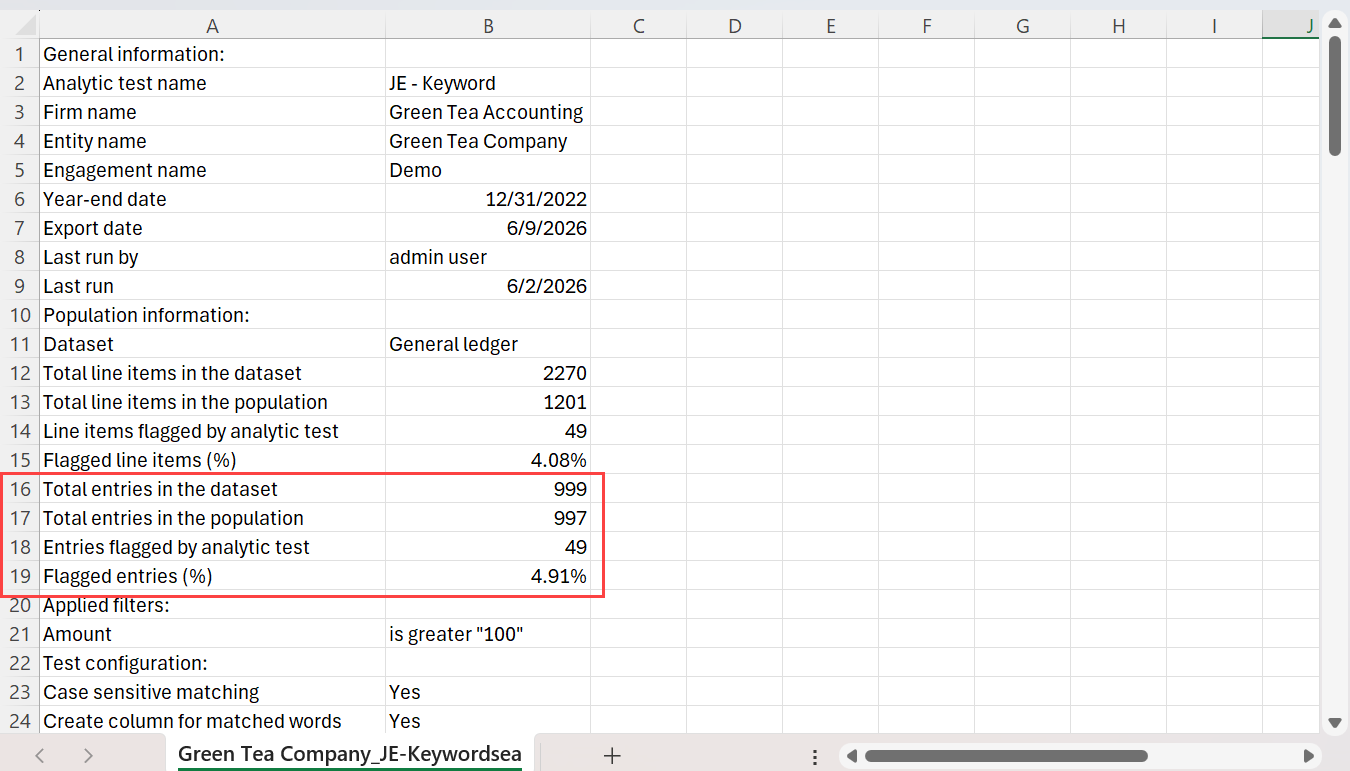
These details help you understand the scope of flagged journal entries and assess their significance without additional calculations.
Dynamically filter data for analytic tests
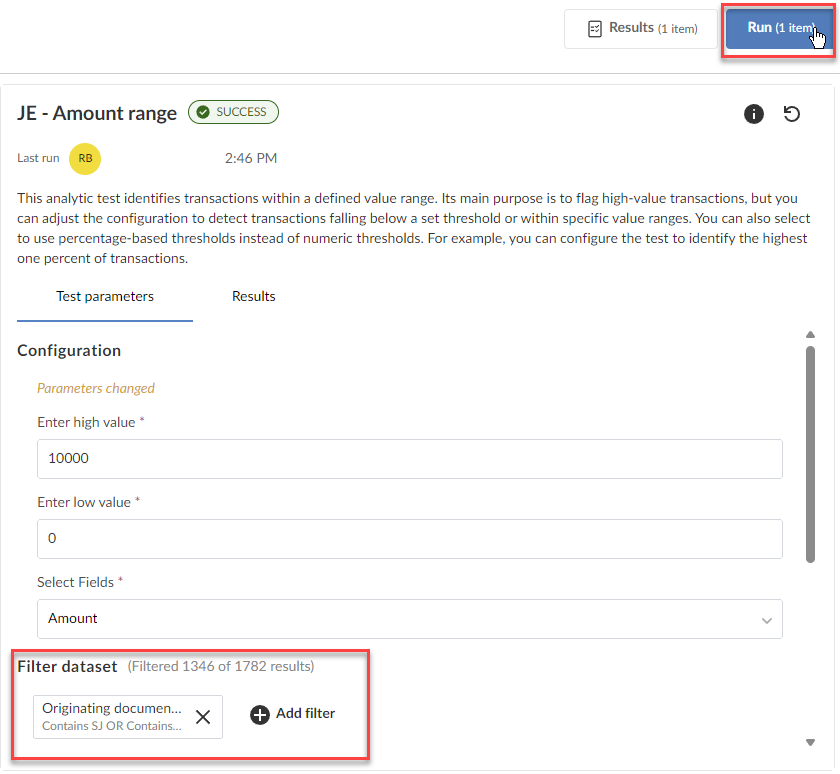
You can filter the source dataset for an analytic test and then run the test on the subset of data identified by the filter.
To dynamically filter data for an analytic test:
-
In the Analytics Hub, select the analytic test whose input dataset you want to filter.
-
In Filter dataset, select + Add filter to create a filter condition that will be applied to a single column of the input dataset.
-
Select the column where you want to apply a filter.
-
One or more filtering conditions are supported in a filter.
-
Multiple filtering conditions can be connected with logical connectives such as AND, OR, or NOT.
-
Each filtering condition is applied only to a single column of the input dataset.
-
Conditional arguments vary by data format. For example, in a date column, you can specify a range.
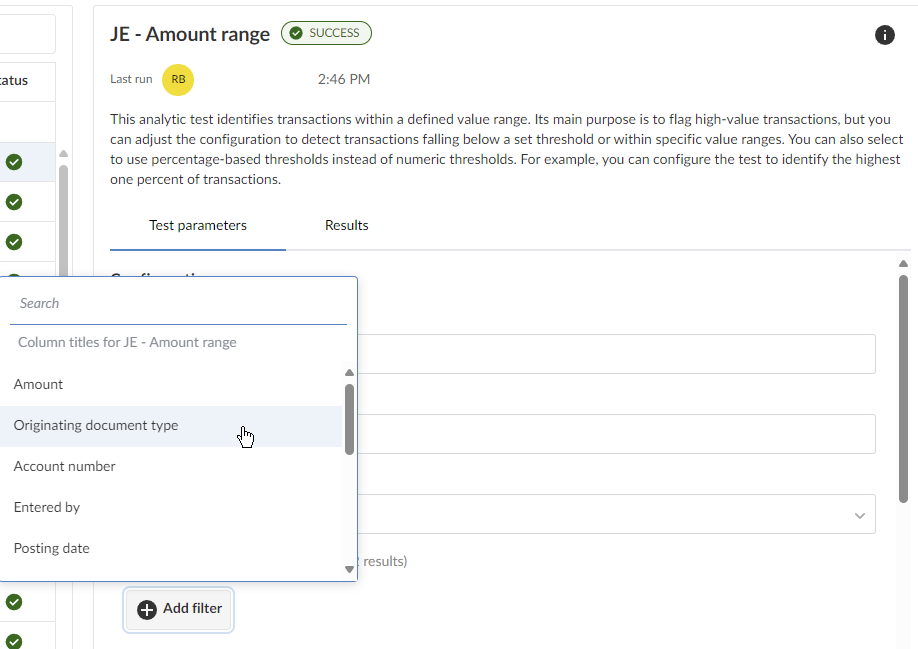
- Create the filter condition and select Filter to run it.
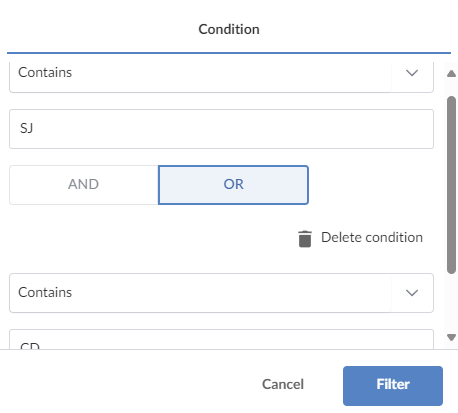
The number of data rows matching the condition appears.
- You can then run the analytic test on this subset of data by clicking Run.
Internal consolidation in embedded analytics
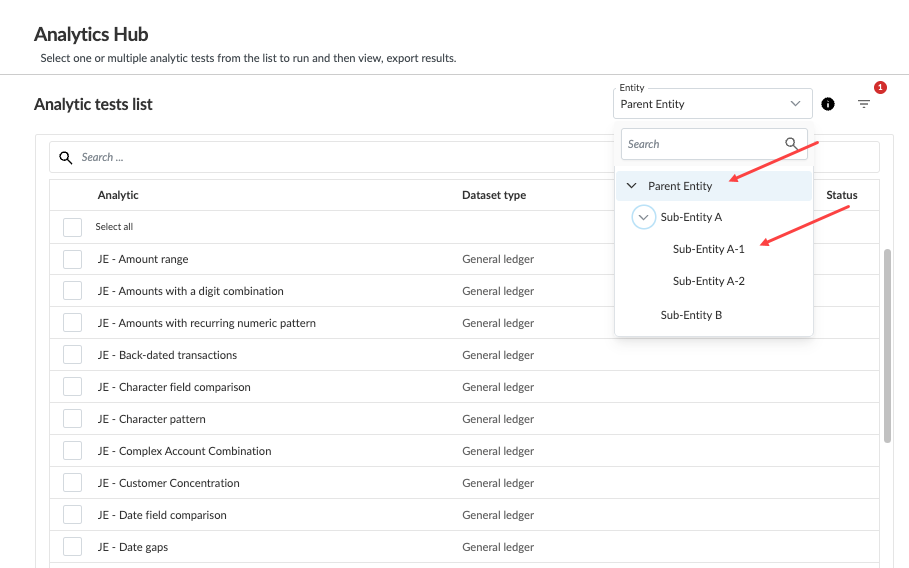
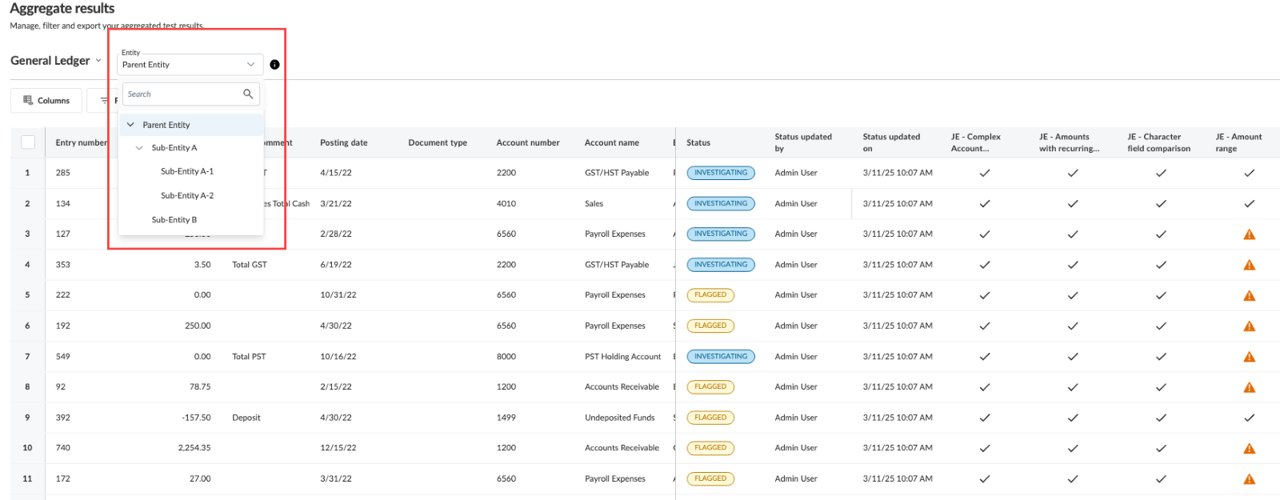
You can now analyze data across entities within a consolidation engagement from the Analytics Hub tab. This allows the user to:
-
Evaluate engagement-level datasets effectively
-
View aggregated results by entity
-
Ensure a comprehensive review of organizational data for accurate and informed audit conclusions
The feature integrates seamlessly with existing analytics workflows, ensuring minimal disruption to user operations.
Appropriate error messages are displayed when permissions are insufficient or when cross-entity datasets are incompatible.
To use this feature, you will first need to know how to create a consolidation engagement. From within a consolidation engagement, you can select the parent or any child entity to view its analytic results from the Analytics Hub tab.