Perform data analysis
Your next step after Planning is to proceed to the Analysis folder to perform data analysis. This is where you look for trends, compare and calculate ratios, investigate discrepancies and confirm expectations.
In the B-305 Overall Analysis document:
-
You can hide or display specific charts by selecting the toggles (
 ) at the top of the page.
 -
You can use the dropdowns at the top to switch the display between Preliminary balances and Final balances.
-
Each chart has a section where you can enter comments or notes.
-
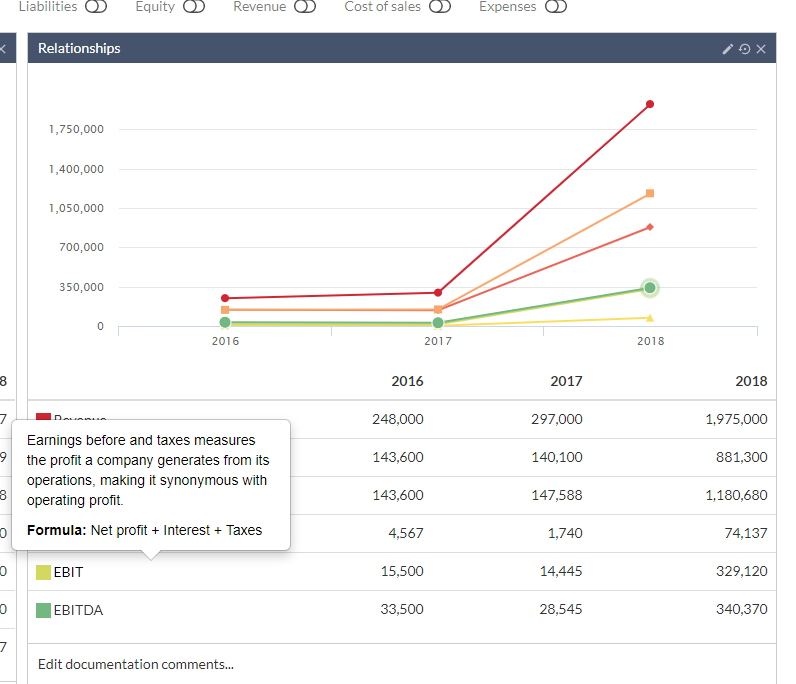
You can hover the graphs to view a tooltip that shows the data a specific bar or line represents. Note that the corresponding data in the table is highlighted as well.

If you hover the data labels in the table, a tooltip displays showing the definition of each label and the formula used to calculate it.
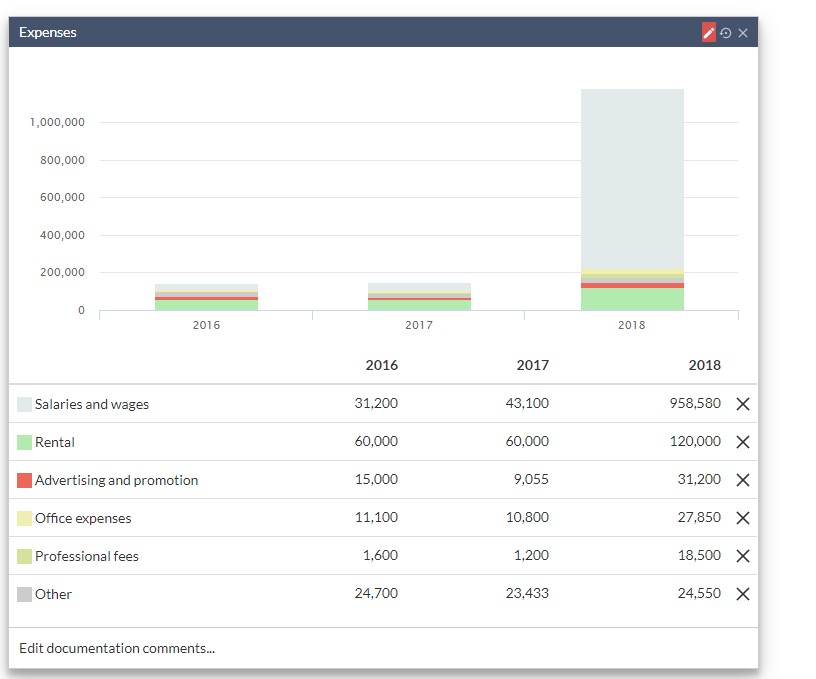
In the overall bar chart, you can select a specific financial statement area to open the corresponding bar chart as an alternative to enabling it using the toggles at the top of the page. In the following figure, we selected Total expense to display a separate bar chart for it below.

In a financial area bar chart, you can remove one or more data set from the chart and compare results. Select Edit (![]() ), then select Delete (
), then select Delete (![]() ) to remove one or more data set. You can revert to the original chart by selecting the Edit (
) to remove one or more data set. You can revert to the original chart by selecting the Edit (![]() ) then Revert (
) then Revert (![]() ).
).
Analysis sheets for the relevant financial areas in your engagement are also available for review.
The default view in analysis sheets is to show data for accounts and groups. You can modify the setting to show groups only or accounts only.
