Analysen im Analyse-Hub verwalten
Der Analyse-Hub ist ein zentraler Ort, an dem Sie alle in Ihrem Engagement verfügbaren Analysen anzeigen und verwalten können. Über den Analyse-Hub können Sie
-
Alle für Ihr Engagement verfügbaren Analysen anzeigen
Hinweis: Analysen, die mit versteckten Checklistenverfahren verknüpft sind, werden im Analyse-Hub nicht angezeigt
-
Analysestatus und Ergebnisse anzeigen
-
Analysen filtern
-
Anpassungen der Analysekonfigurationen vornehmen
-
Navigieren Sie zu verlinkten Checklistenverfahren
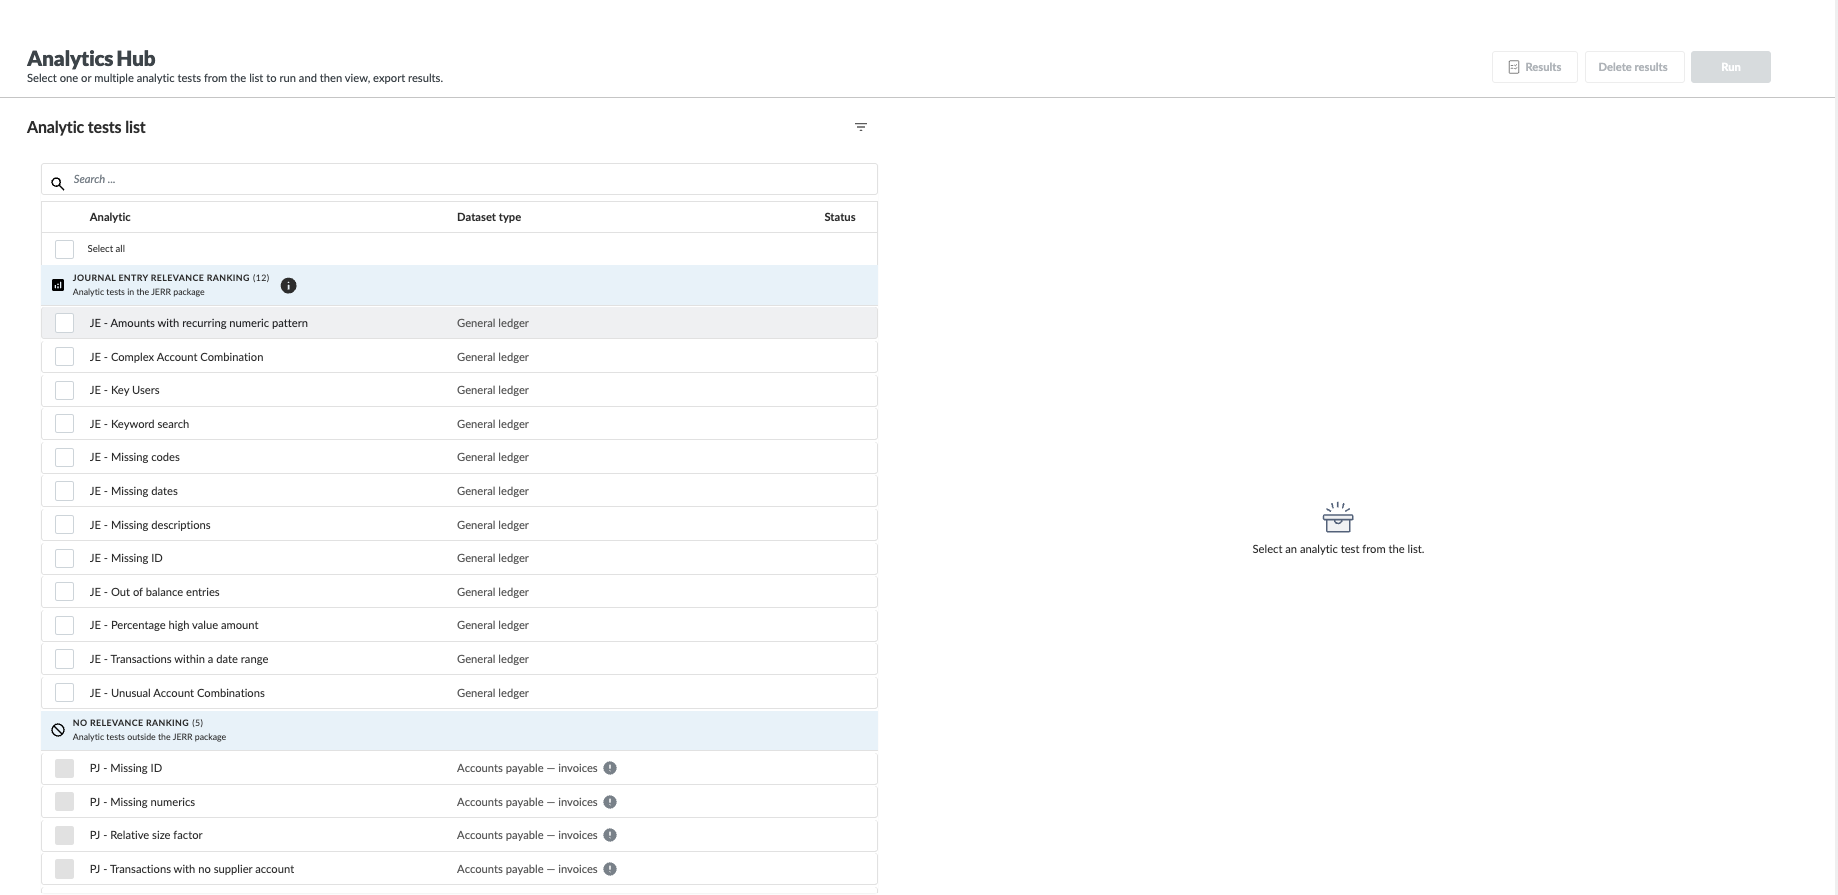
To open the Analytics Hub, select Analytics Hub in the top menu. Wenn Sie die Seite öffnen, wird auf der linken Seite eine Liste aller Analysen angezeigt, die für Ihr Engagement verfügbar sind. Tests are grouped under Journal Entry Relevance Ranking and No relevance ranking. Um die gewünschte Analyse zu finden, können Sie die Suche oder einen Filter verwenden.
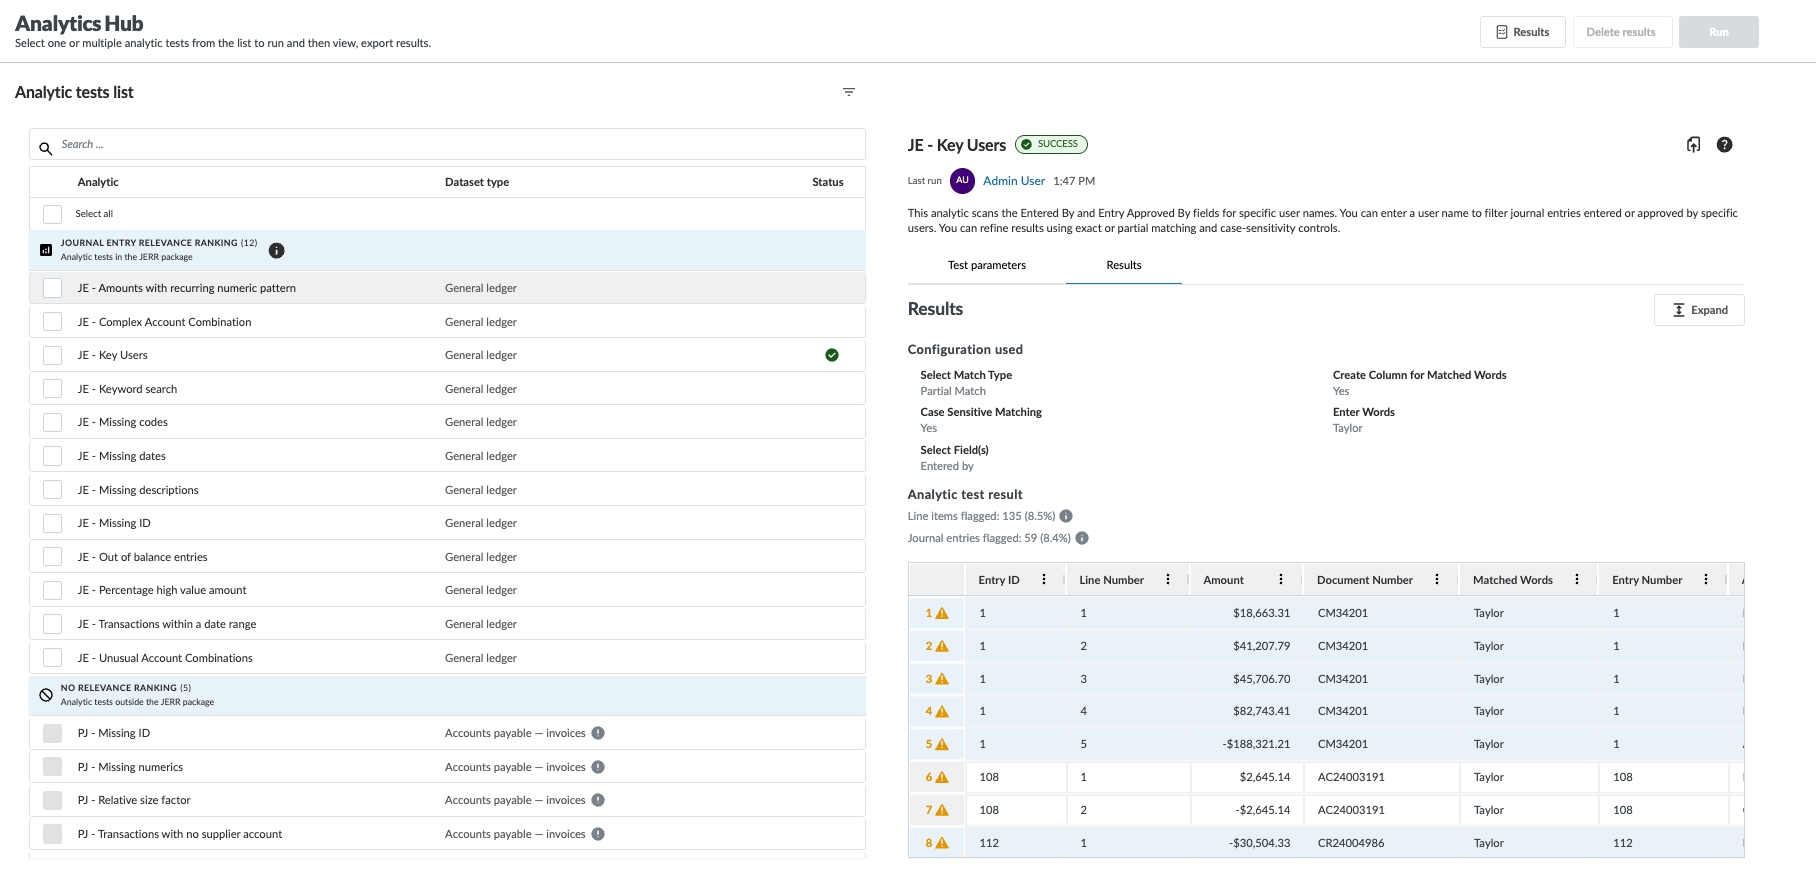
Once you open a test, you can adjust the configuration or navigate to the linked checklist procedures on the Test Parameters tab. To run the test, select the Run button and then view the results on the Results tab for the test. Beachten Sie, dass Sie mit Hilfe der Kontrollkästchen auch mehrere Analysen auswählen und gleichzeitig durchführen können This includes running Journal Entry Relevance Ranking (JERR) tests together with additional journal entry tests and sub-ledger analytics. Tests that do not contribute to the relevance ranking appear under No relevance ranking.
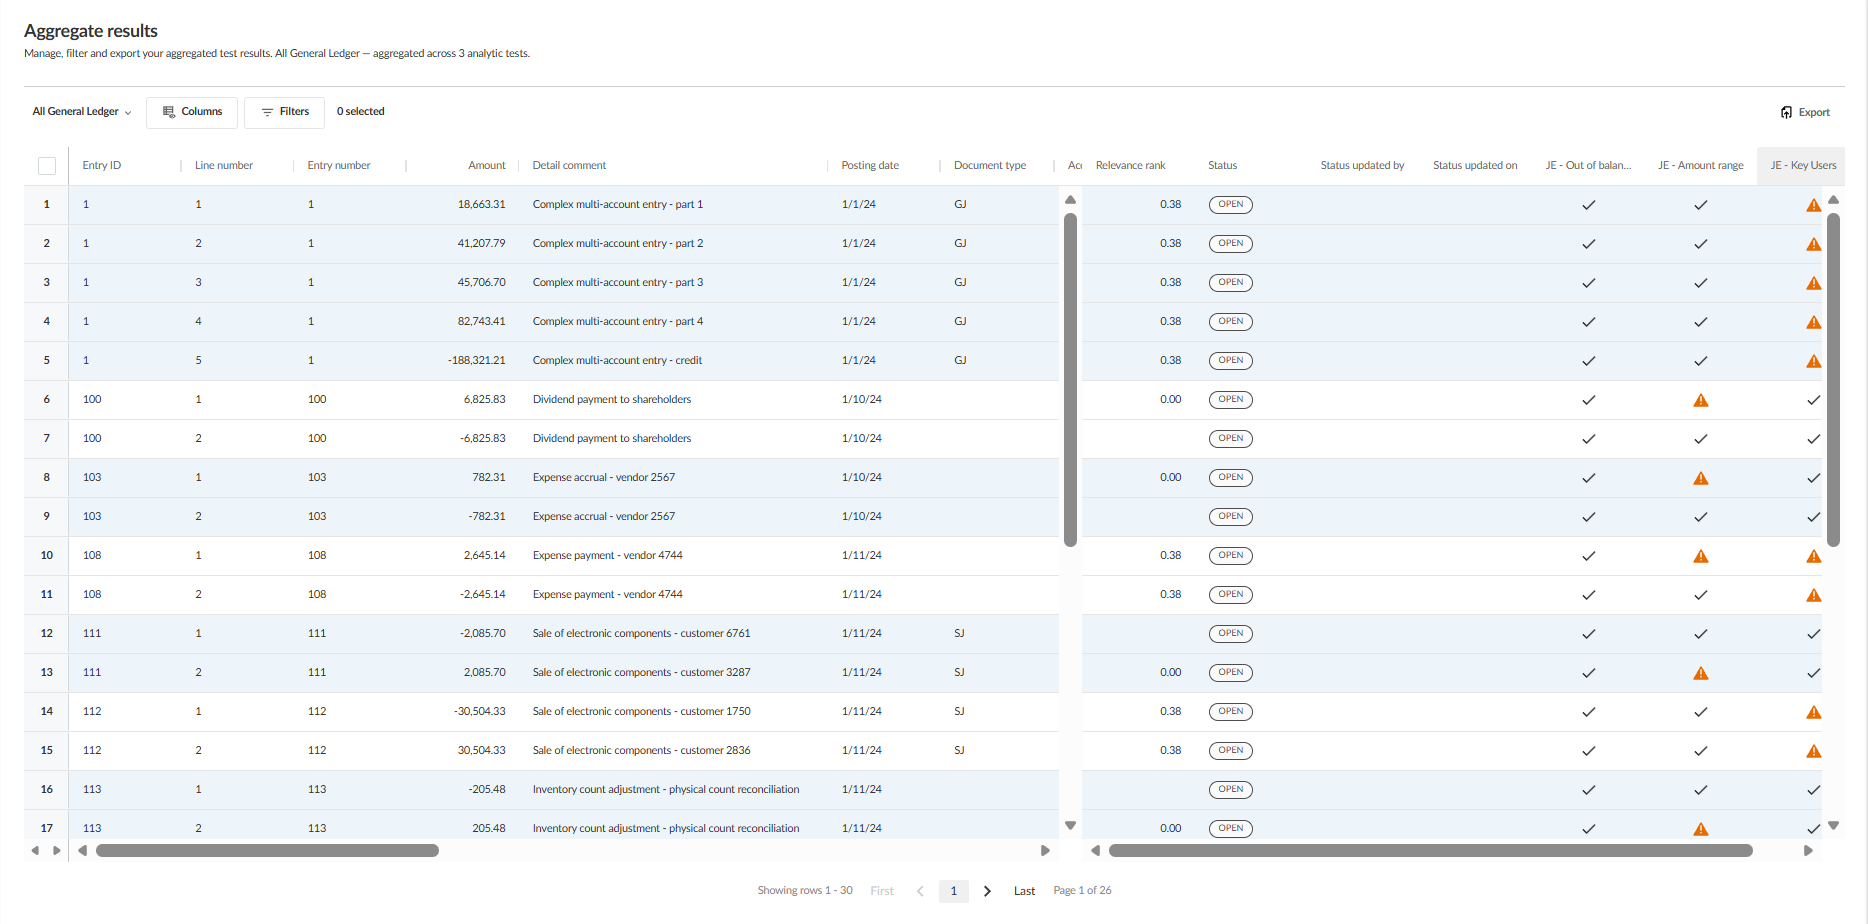
To open the Aggregated Results page, select the Results button at the top of the page. The Aggregated Results page displays all transactions flagged as a result of all tests that you have run. You can use the Columns and Filters options to filter the results you see and use the Export button to export the results to a CSV file.
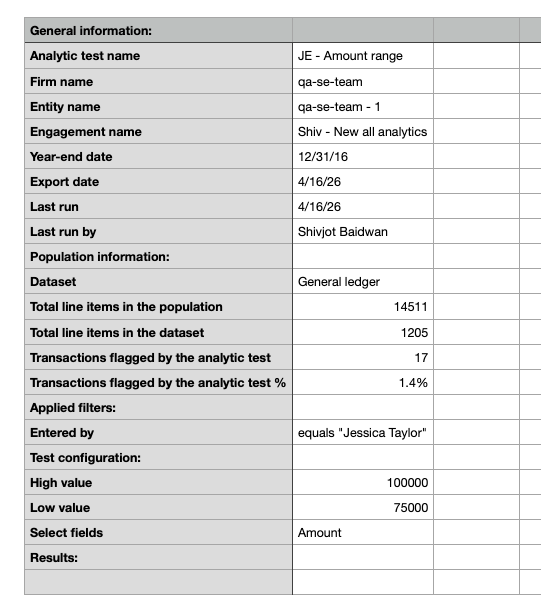
Exported analytic results include:
-
Metadata fields that describe the analytic run and dataset. Recent updates include:
-
A new Last run field showing the date of the most recent analytic execution
-
Renamed fields such as Last run by and Export date for improved clarity
-
-
Filters applied to an analytic test, which help you review, explain, and decide whether you need to run the test again
-
Summary metrics in export metadata, including:
-
Total line items in dataset
-
Total line items in population
-
Line items flagged by analytic test
-
Flagged line items (%)
-
These details help you understand how results were generated and assess the significance of flagged items without additional calculations.
Total line items in the dataset, total line items in the population (if filters applied), number and percentage of line items flagged by analytics can also be viewed from the Results tab.
Flagged Journal Entries View
When journal entry view is enabled, results in the Analytics Hub display all line items belonging to the same journal entry, not just the flagged line item. This gives you the full context of an entry, including its purpose and financial impact.
View journals with flagged line items
You can view journals with flagged line items for any analytic test.
To view journal entry results:
-
Wählen Sie im oberen Menü Analyse-Hub.
Wenn Sie die Seite öffnen, wird auf der linken Seite eine Liste aller Analysen angezeigt, die für Ihr Engagement verfügbar sind.
-
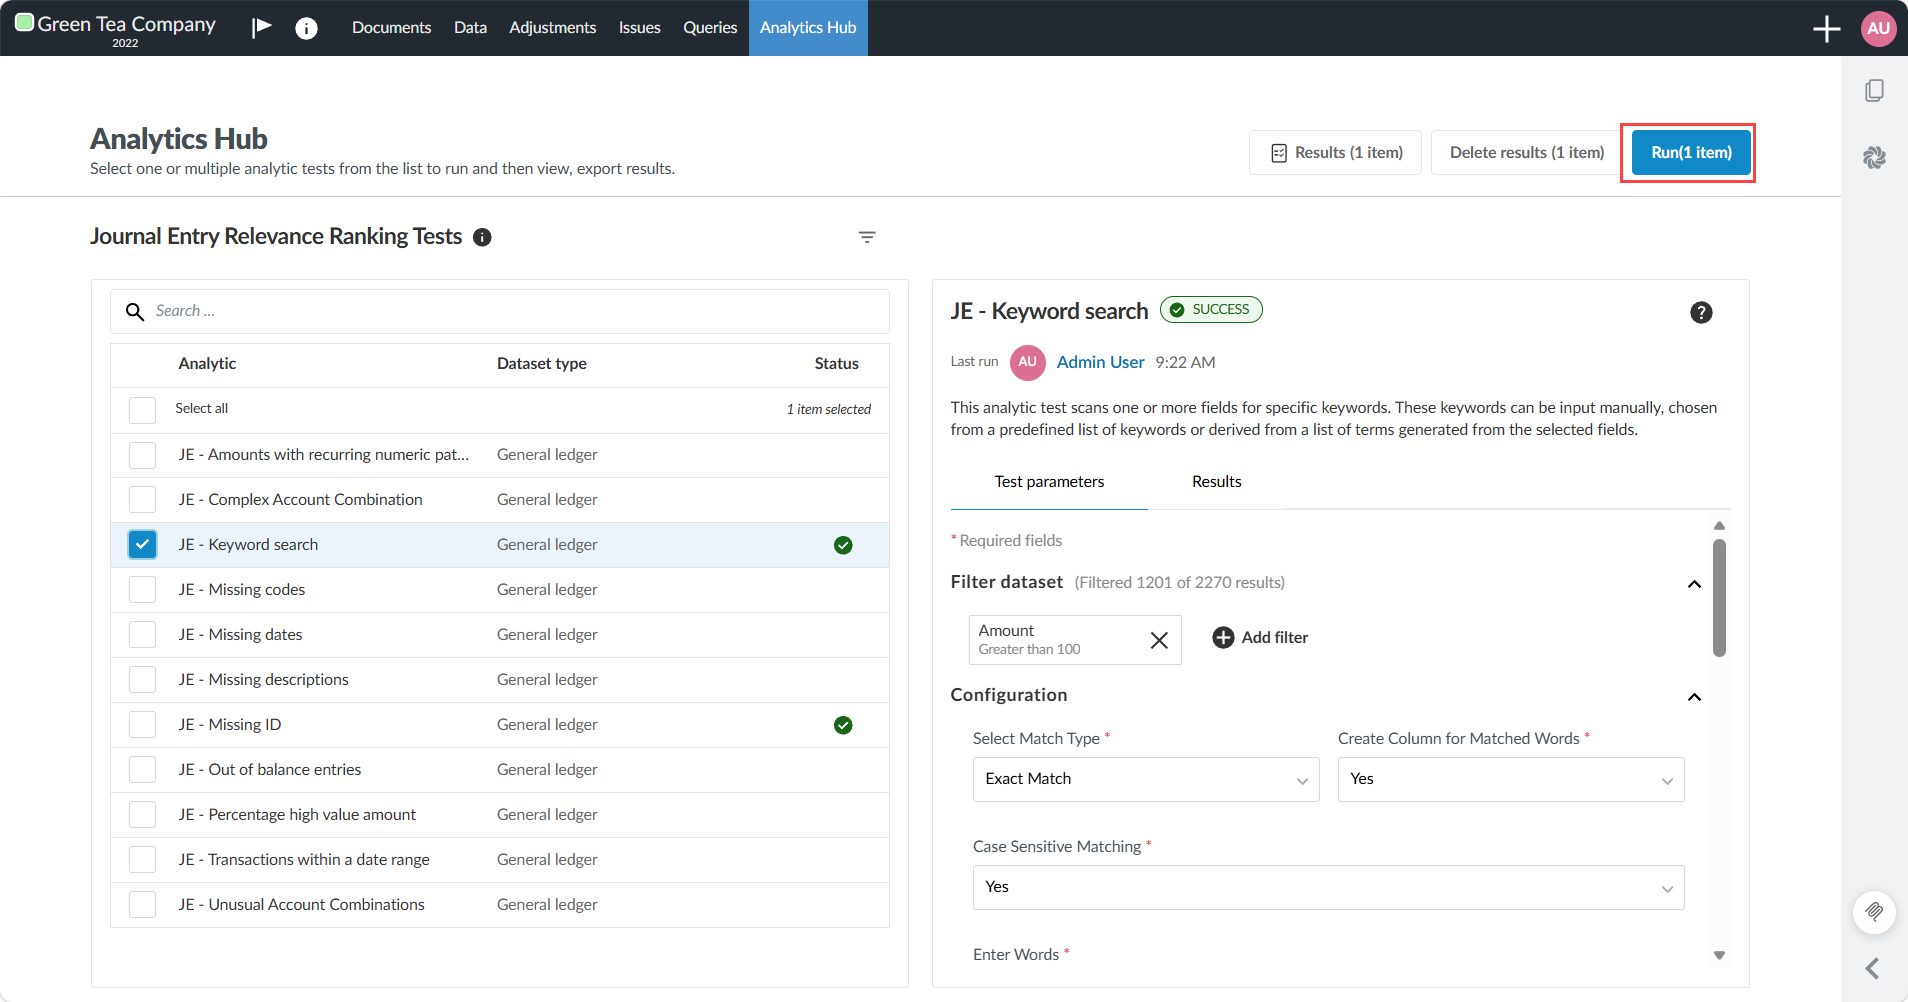
Select an analytic test. You can search or use the filters to find the test you're looking for.
-
Select Run at the top of the page.
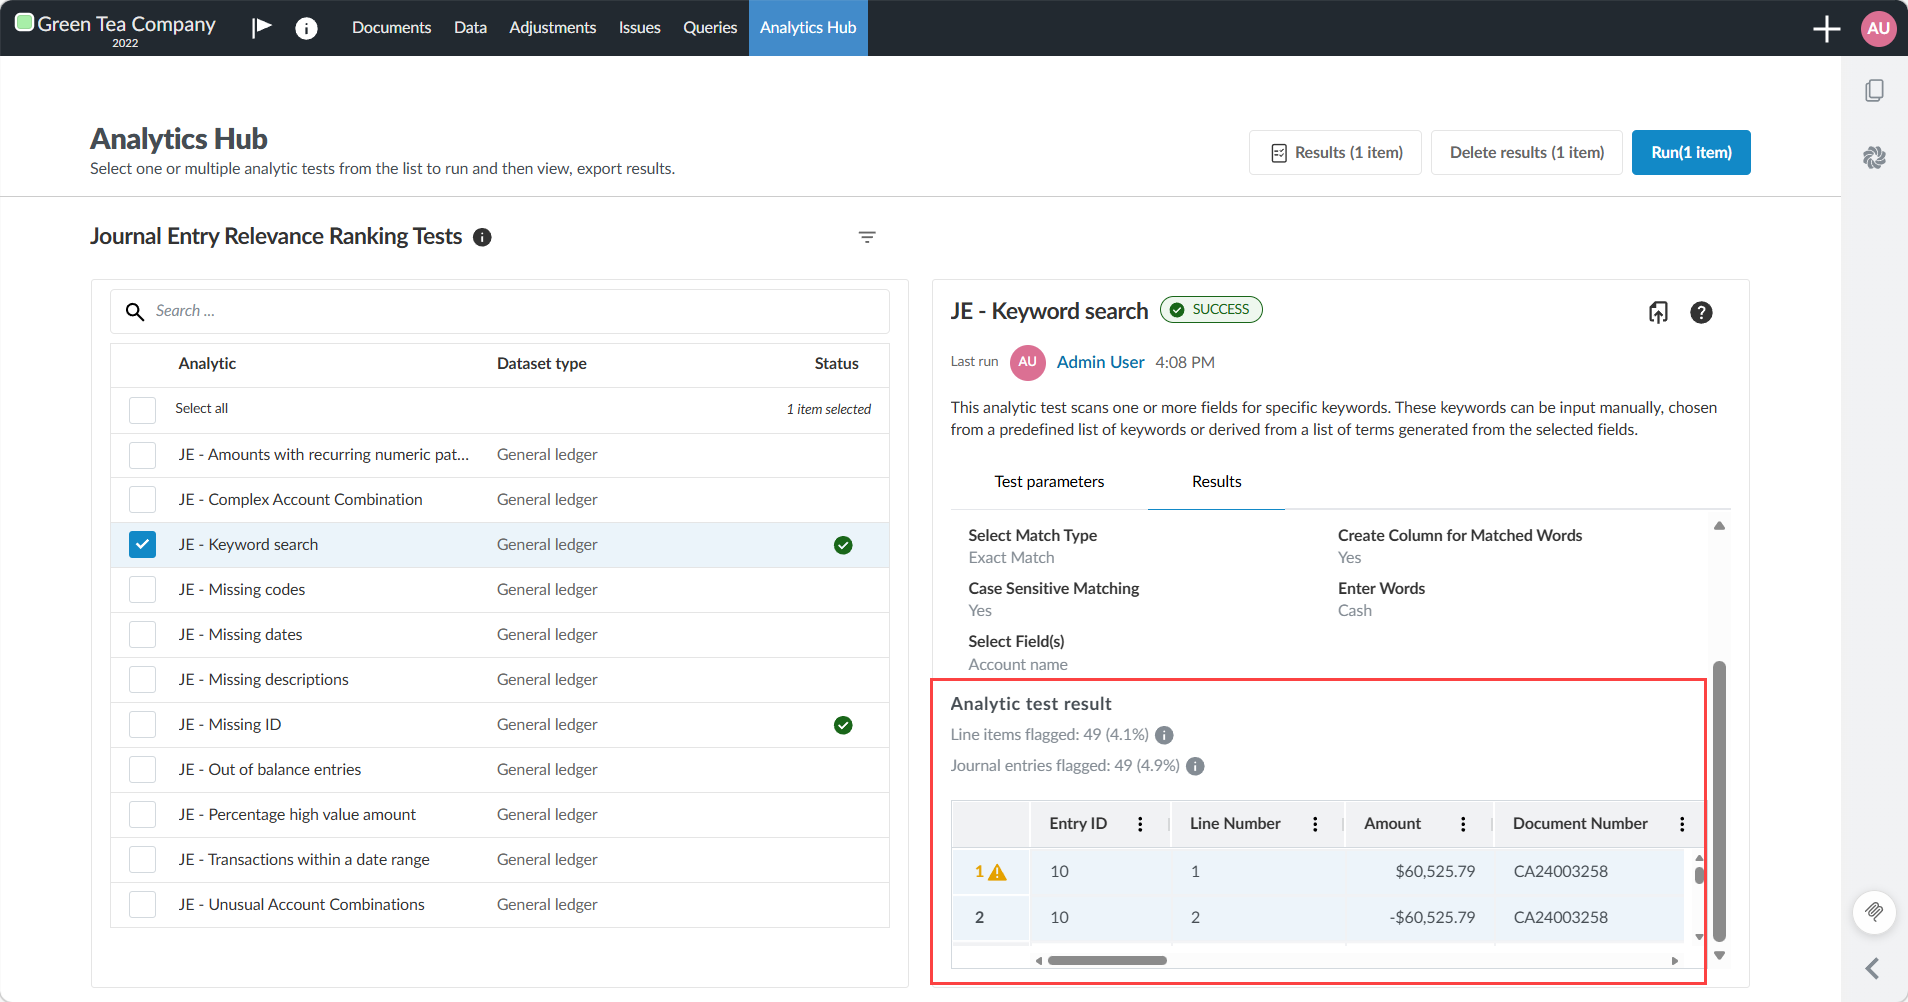
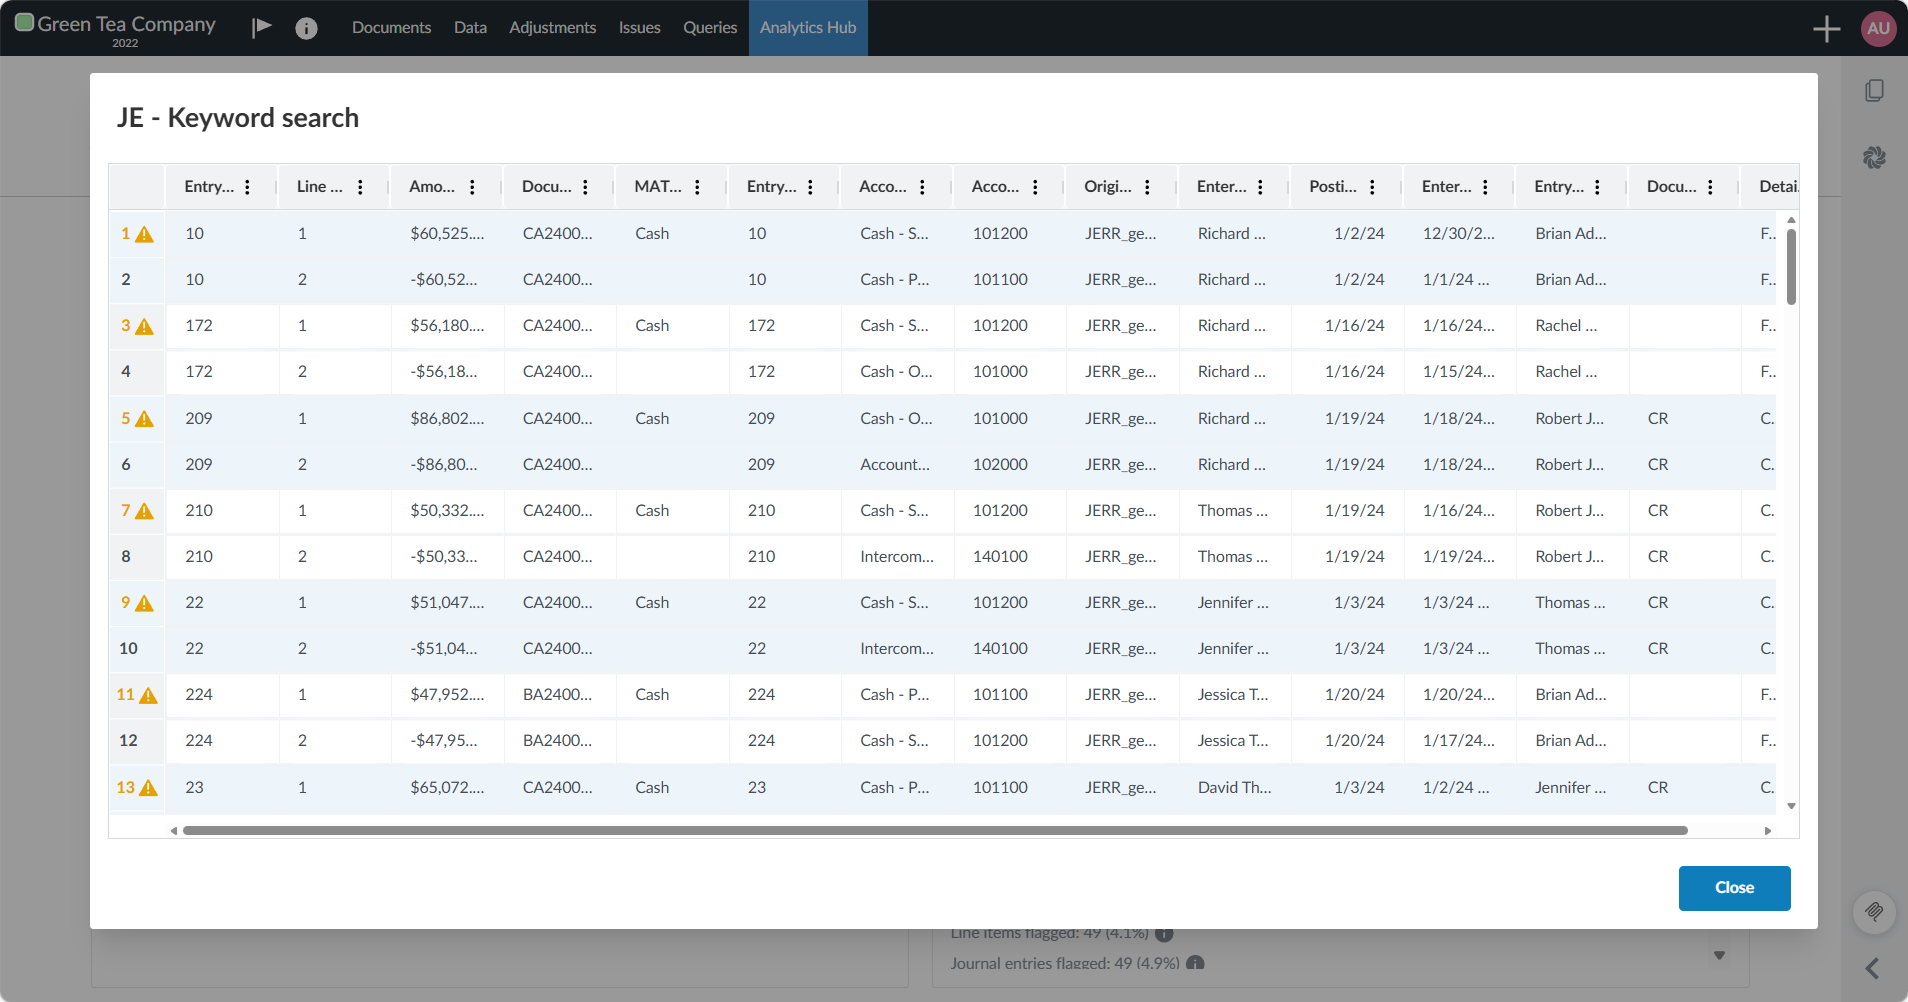
Results display grouped by journal entry in alternating colors for easy identification. Each group shows all line items associated with the same Entry ID. Flagged line items are indicated with a warning sign.
The Analytic test result section above the grid shows:
-
Line items flagged and percentage
-
Journal entries flagged and percentage
-
-
Select Expand to display the full results.
View aggregated results
When you select multiple analytic tests, you can view all results together in the aggregated results view.
To view the aggregated results:
-
Wählen Sie im oberen Menü Analyse-Hub.
-
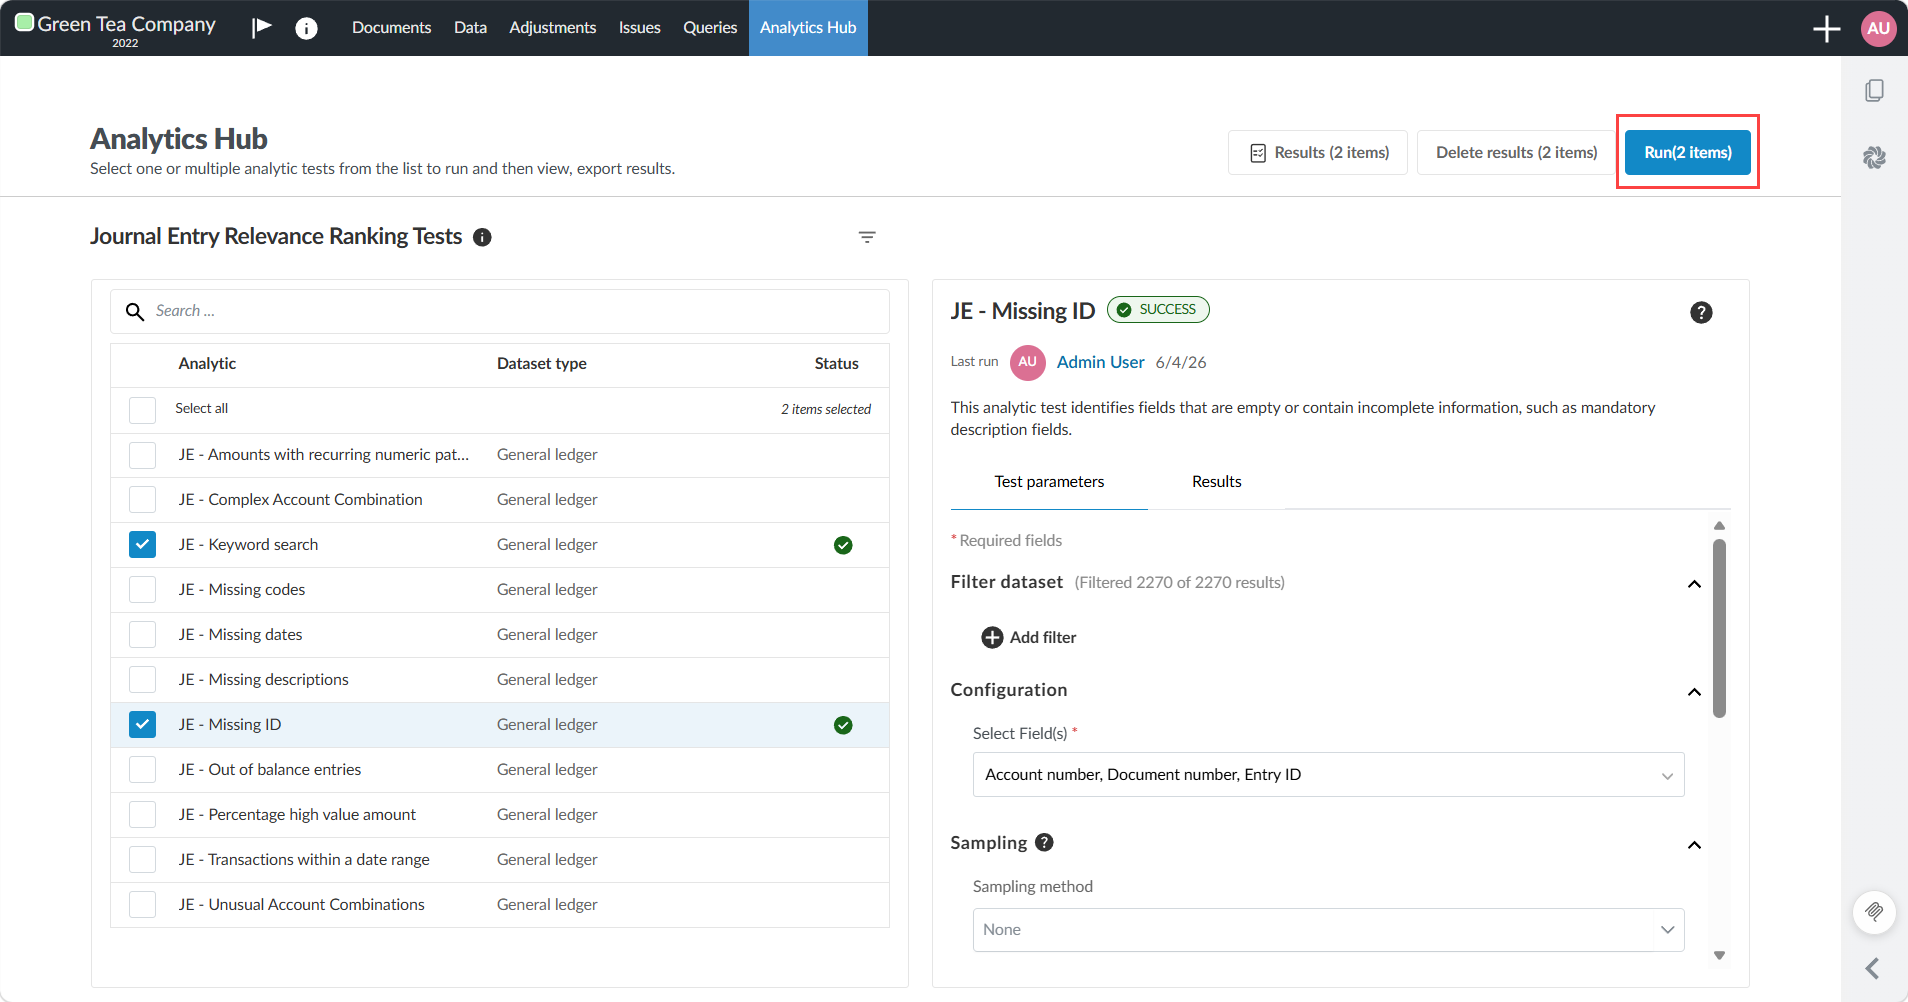
Select multiple analytic tests using the checkboxes. You can search or use the filters to find the test you're looking for.
-
Select the Run button at the top of the page. If you have already run the selected analytic tests, you do not need to run them again.
-
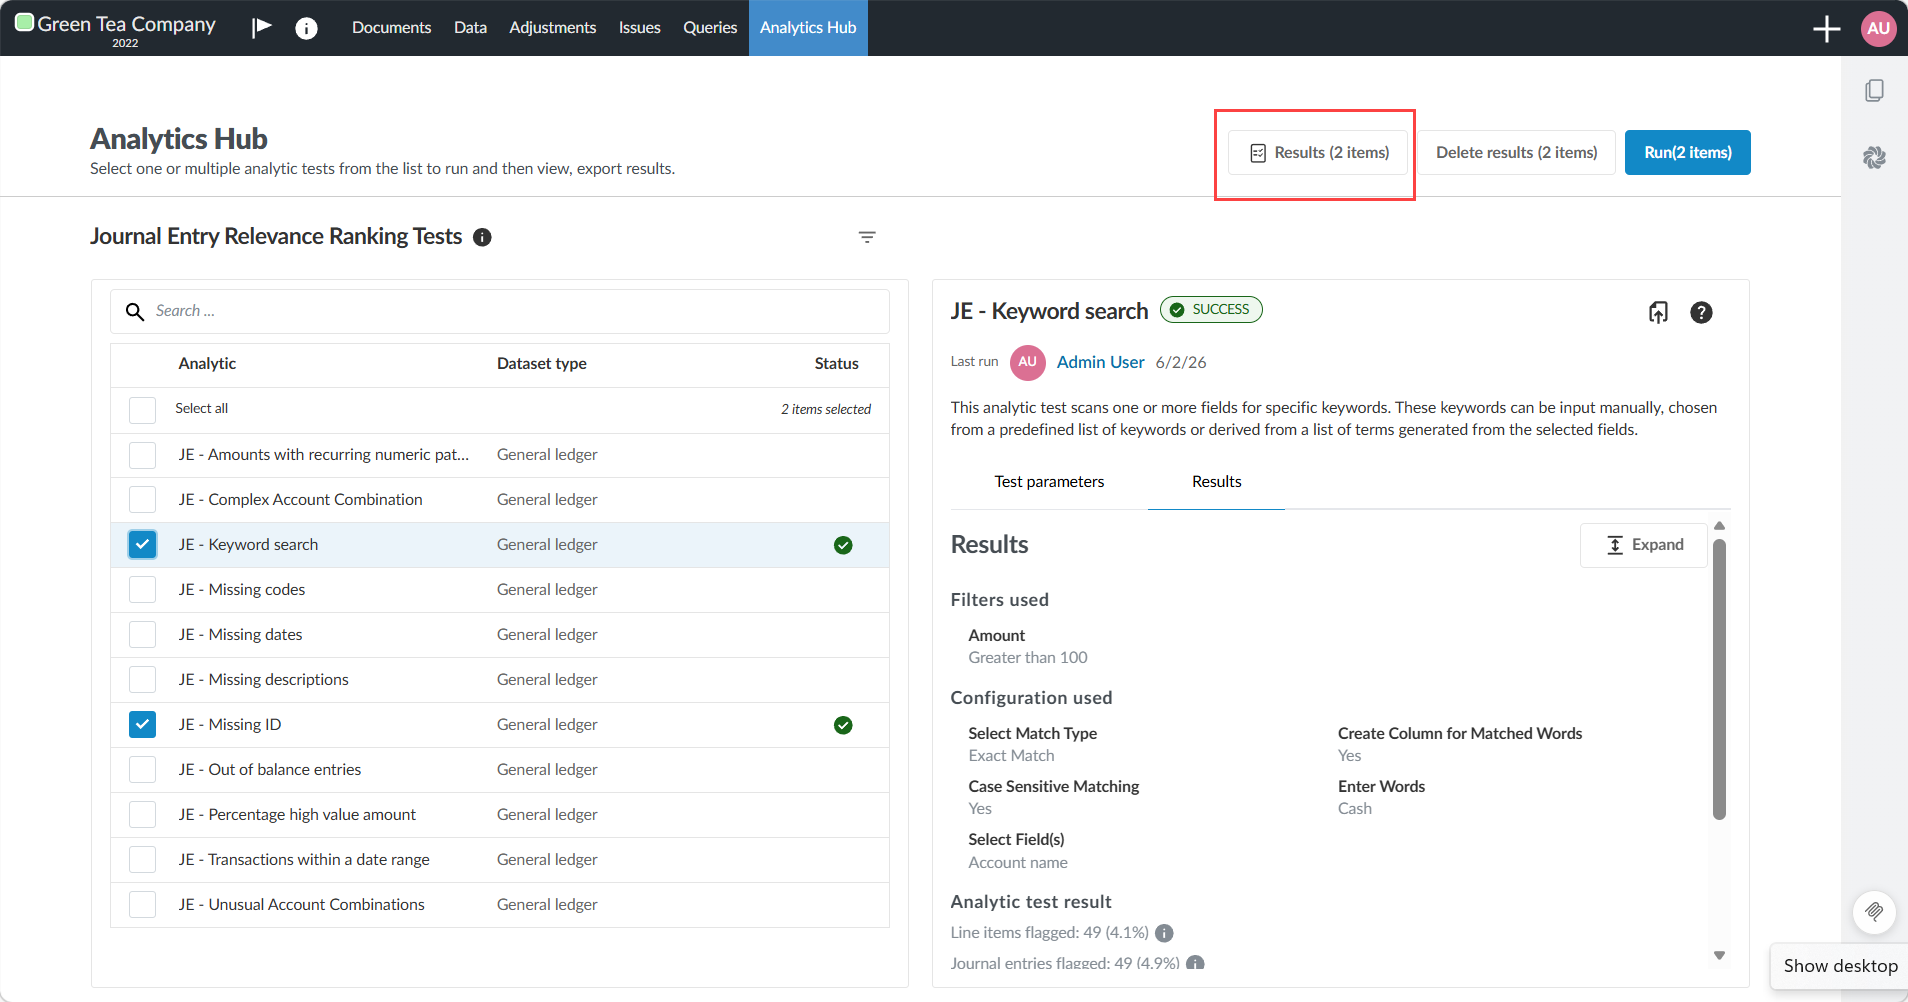
Select the Results tab to display the aggregated results.
Results display grouped by journal entry with alternating colors. Unlike individual test results, flagged items are not indicated with a warning sign. Instead, each analytic test appears as a column showing whether the entry was flagged or passed. What the Relevance rank column shows depends on the view you select on the Aggregated results page. When you select JE - Relevance Rank view, only the Journal Entry Relevance Ranking tests appear, which all have a relevance rank.
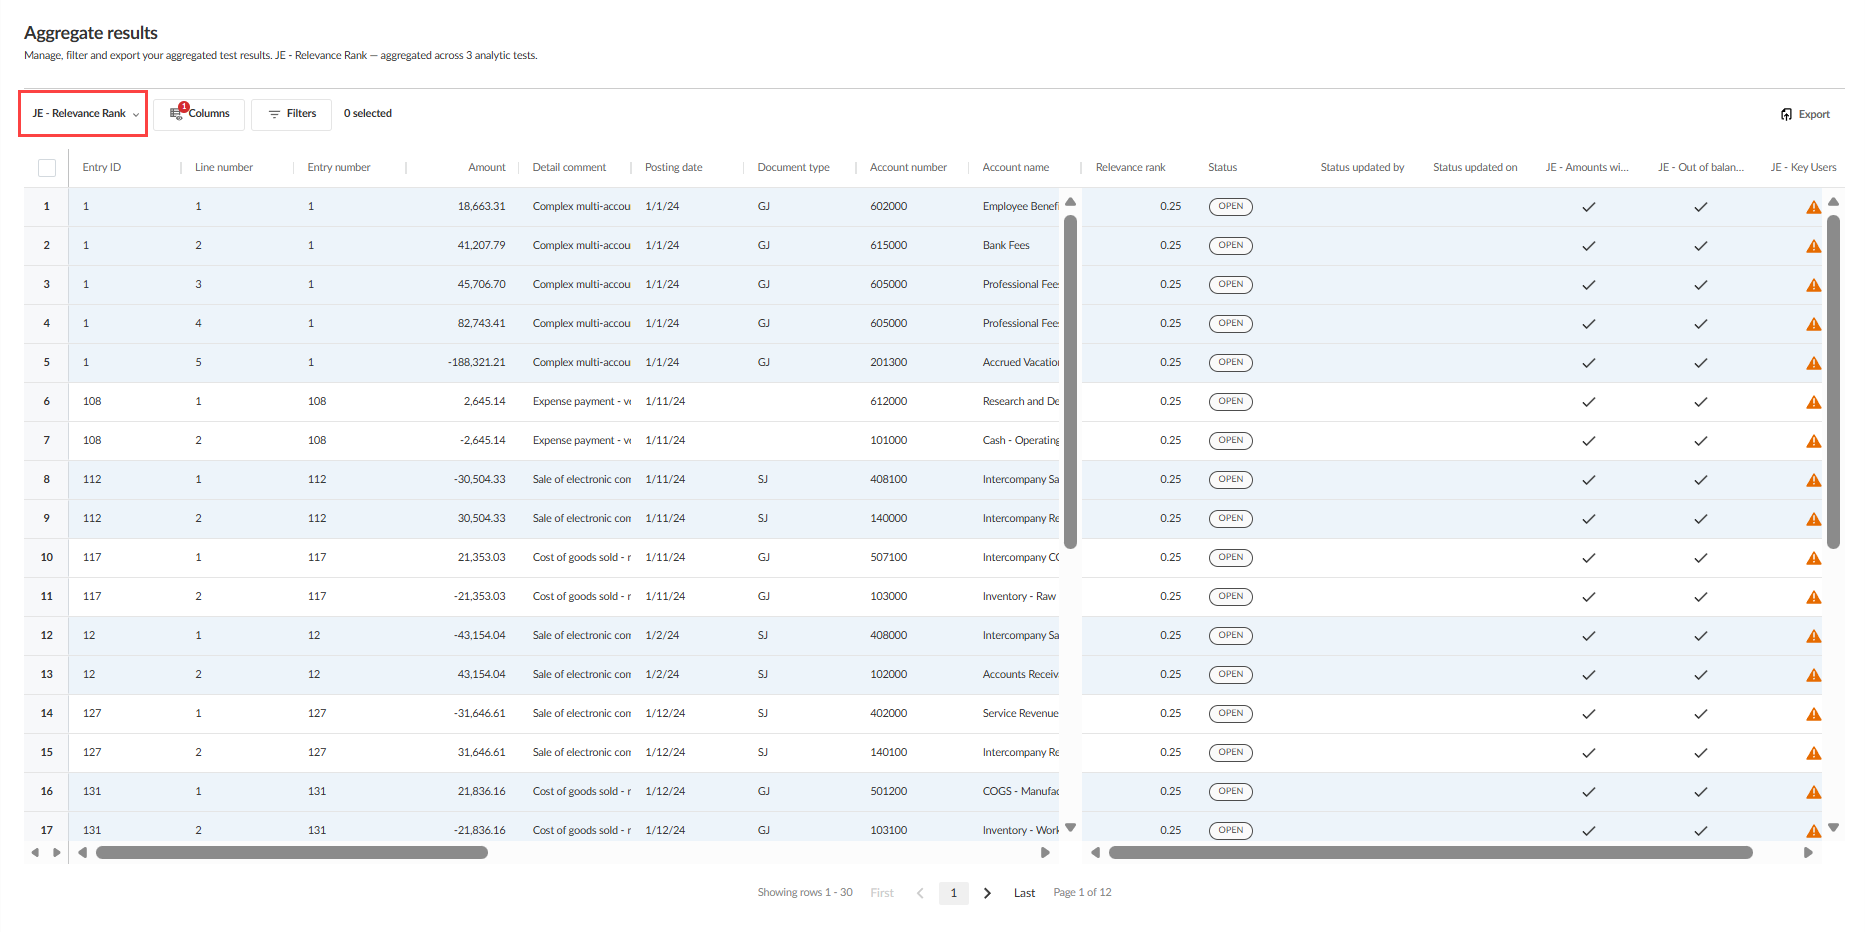
When you select All General Ledger view, additional journal entry tests also appear as columns, but they do not contribute to or change the relevance ranking.
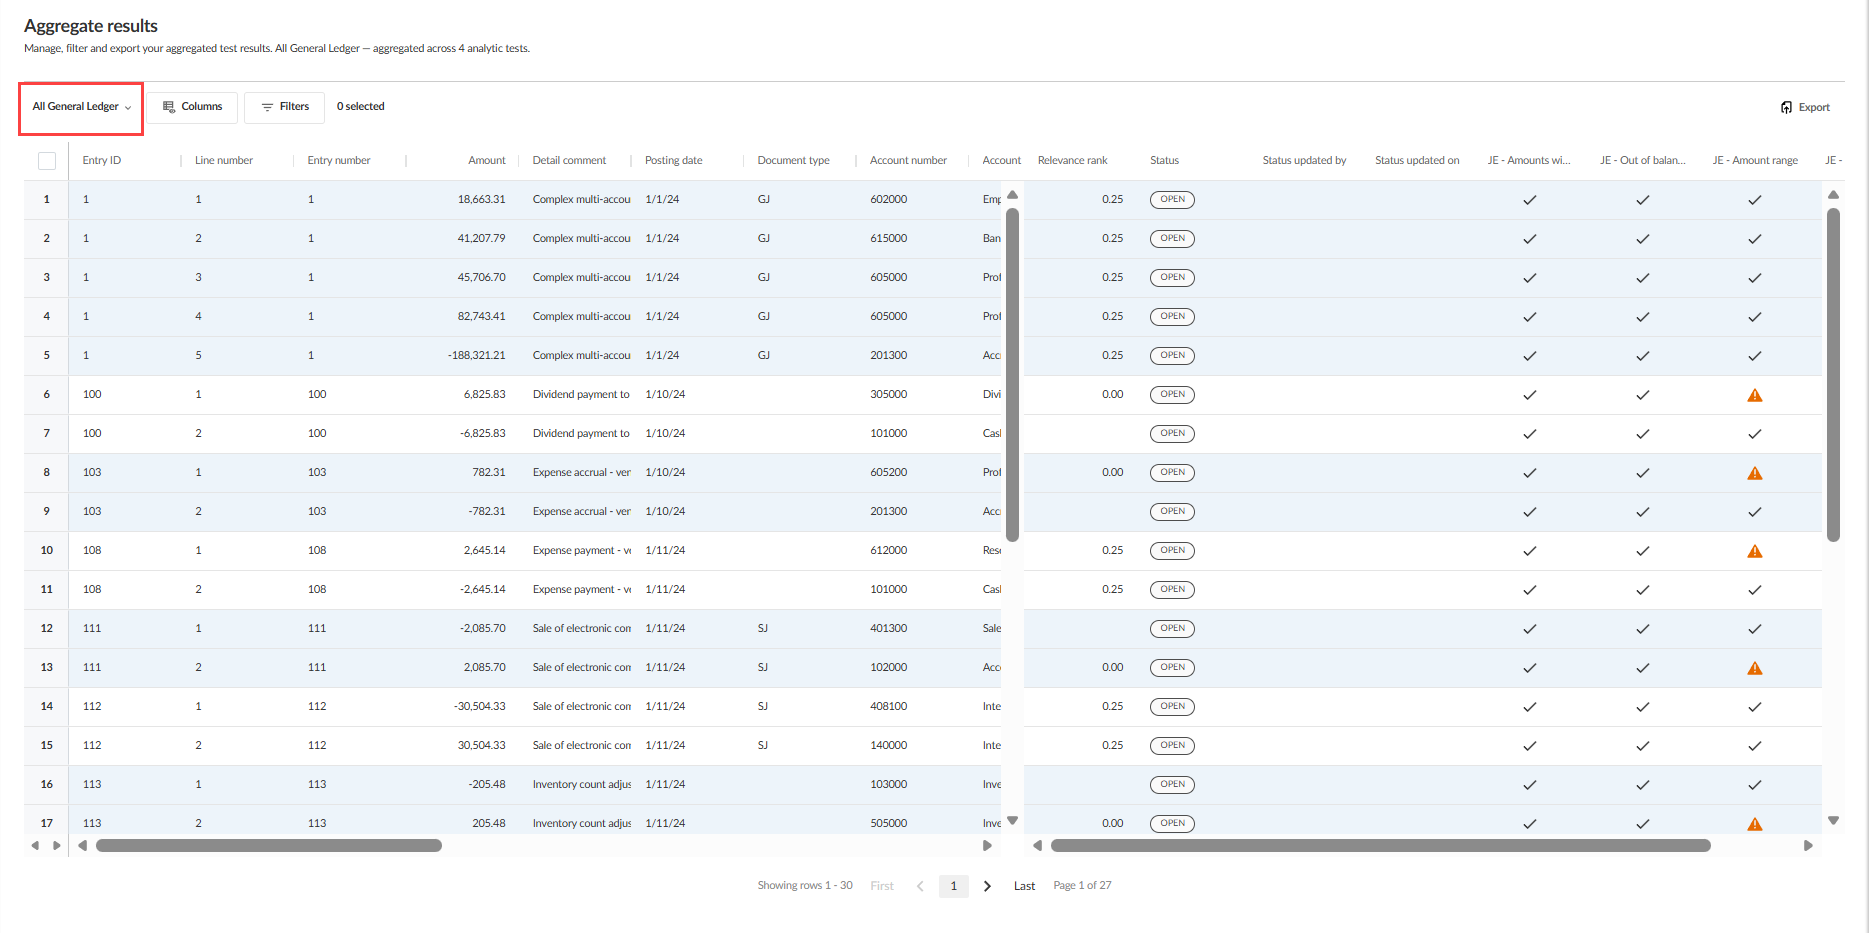
The General Ledger view and each subledger remain unchanged and do not include a relevance rank. Results are sorted by the Relevance rank column, with the most relevant journal entries first. You can use the Columns and Filters options to filter the results you see.
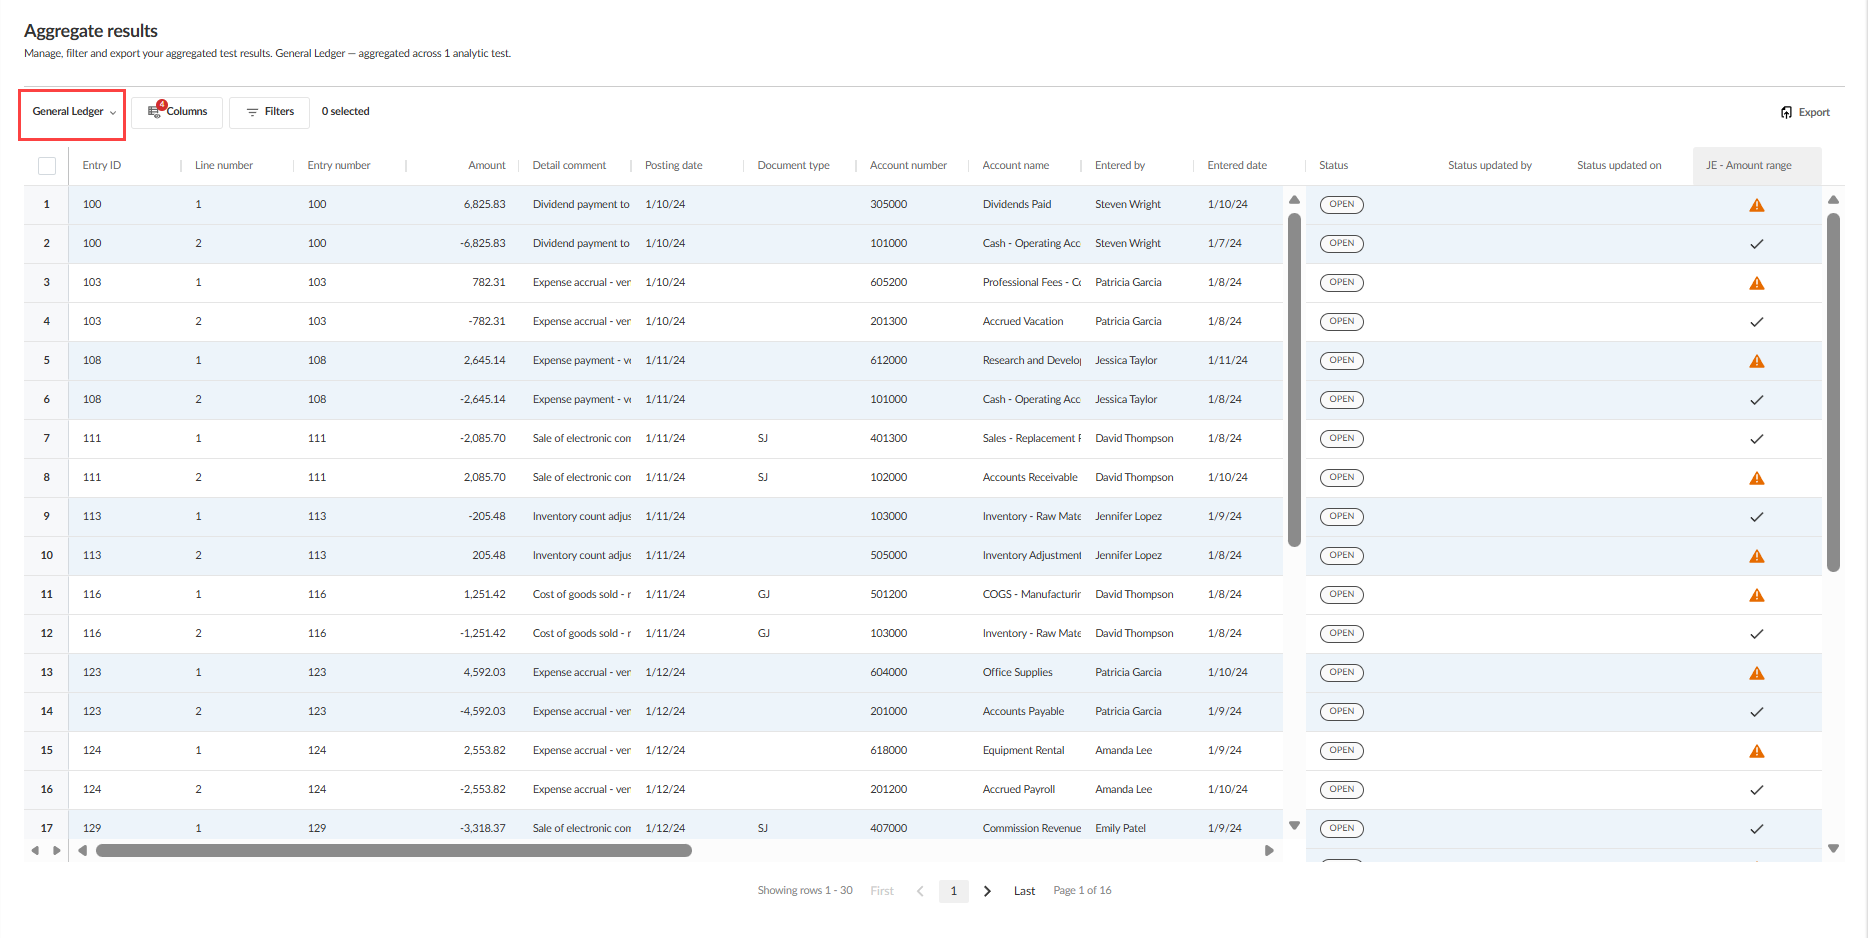
Export journal entry results
Select the Export button to export results to a CSV file. The export metadata includes journal entry flagging information in addition to line item counts. If filters are applied, the export metadata reflects the filtered population.
The export metadata includes:
-
Total line entries in the dataset
-
Total line items in the population
-
Entries flagged by analytic test
-
Flagged entries (%)
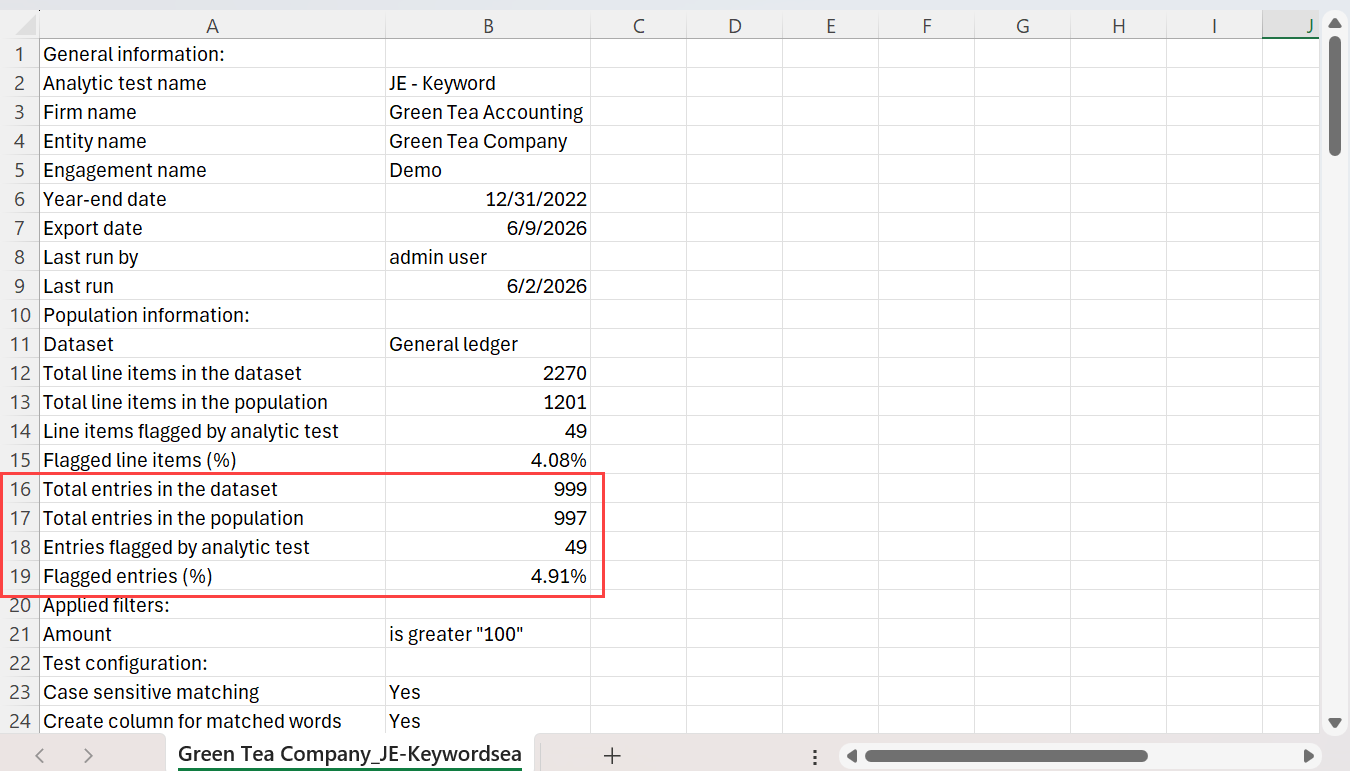
These details help you understand the scope of flagged journal entries and assess their significance without additional calculations.
Dynamisches Filtern von Daten für Analysen
Sie können den Quelldatensatz für eine Analyse filtern und die Analyse dann auf der durch den Filter identifizierten Teilmenge von Daten ausführen.
Dynamisches Filtern von Daten für eine Analyse:
-
Wählen Sie im Analyse-Hub die Analyse aus, deren Eingabedatensatz Sie filtern möchten.
-
In Filter dataset, select + Add filter to create a filter condition that will be applied to a single column of the input dataset.
-
Wählen Sie die Spalte aus, auf die Sie einen Filter anwenden möchten.
-
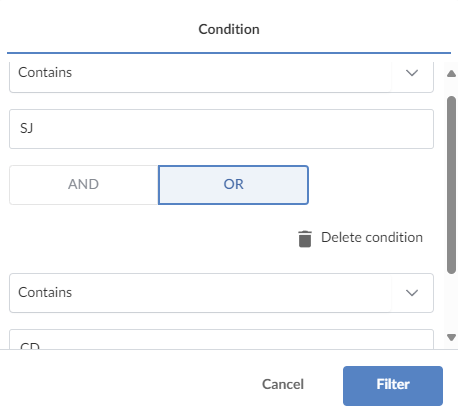
In einem Filter werden eine oder mehrere Filterbedingungen unterstützt.
-
Mehrere Filterbedingungen können mit logischen Verknüpfungen wie AND, OR oder NOT verbunden werden.
-
Jede Filterbedingung wird nur auf eine einzige Spalte des Eingabedatensatzes angewendet.
-
Bedingte Argumente variieren je nach Datenformat. In einer Datumsspalte können Sie zum Beispiel einen Bereich angeben.
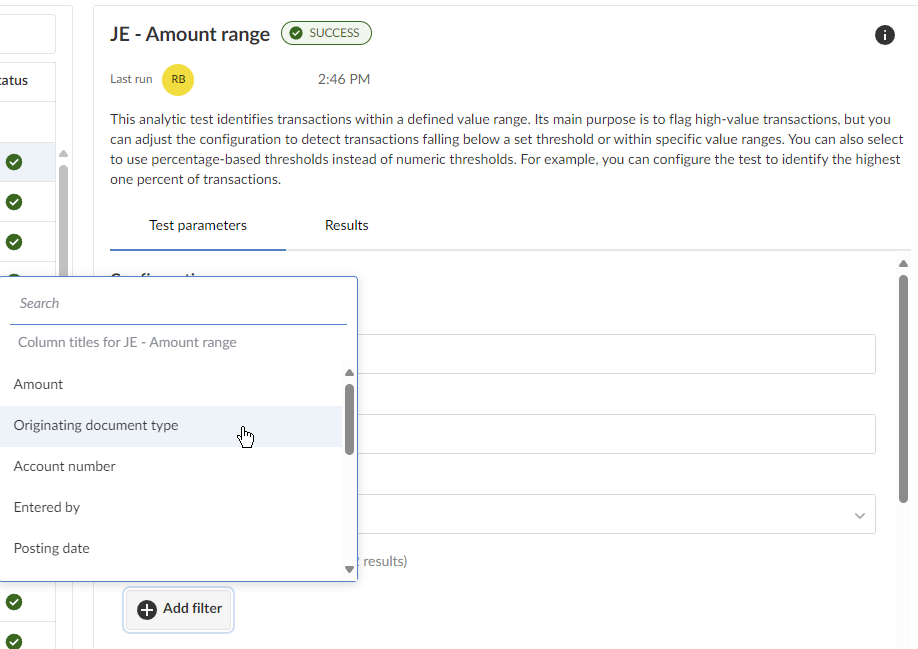
- Erstellen Sie die Filterbedingung und wählen Sie Filter, um sie auszuführen.
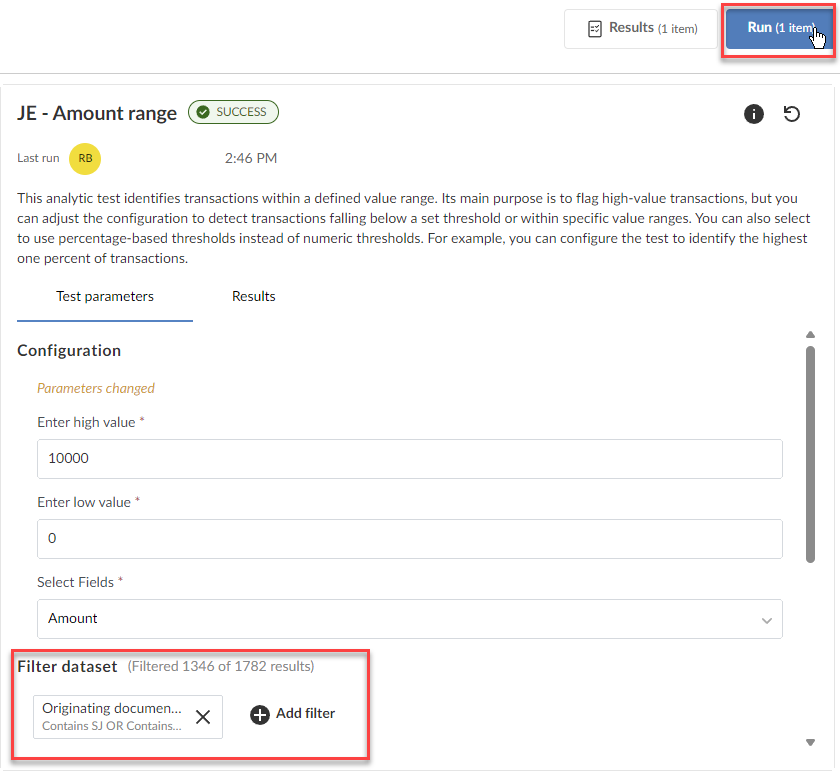
Die Anzahl der Datenzeilen, die die Bedingung erfüllen, wird angezeigt.
- You can then run the analytic test on this subset of data by clicking Run.
Interne Konsolidierung in eingebetteten Analysen
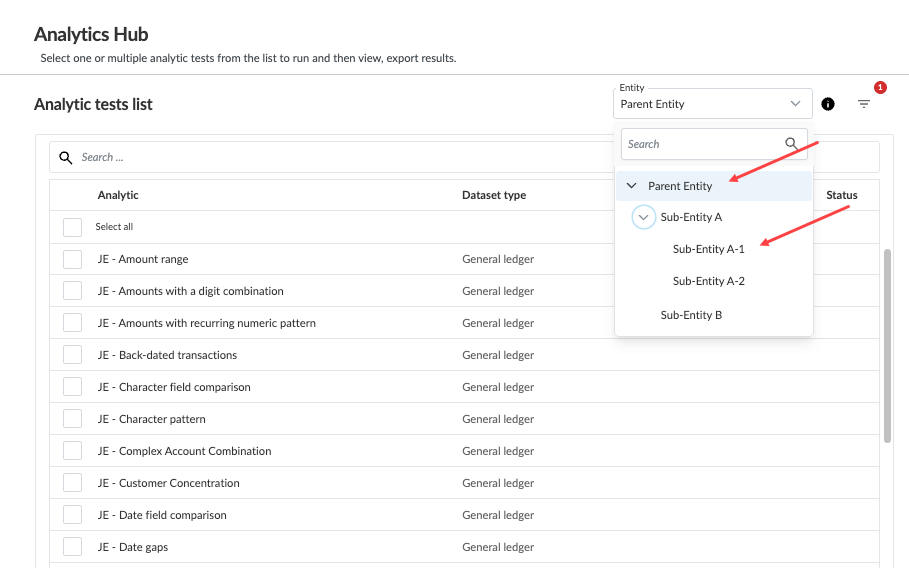
Sie können jetzt Daten über Einheiten hinweg innerhalb eines konsolidierten Engagements über die Registerkarte "Analytics Hub" analysieren. Dies ermöglicht es dem Benutzer:
-
Datensätze auf der Engagementebene effektiv zu bewerten
-
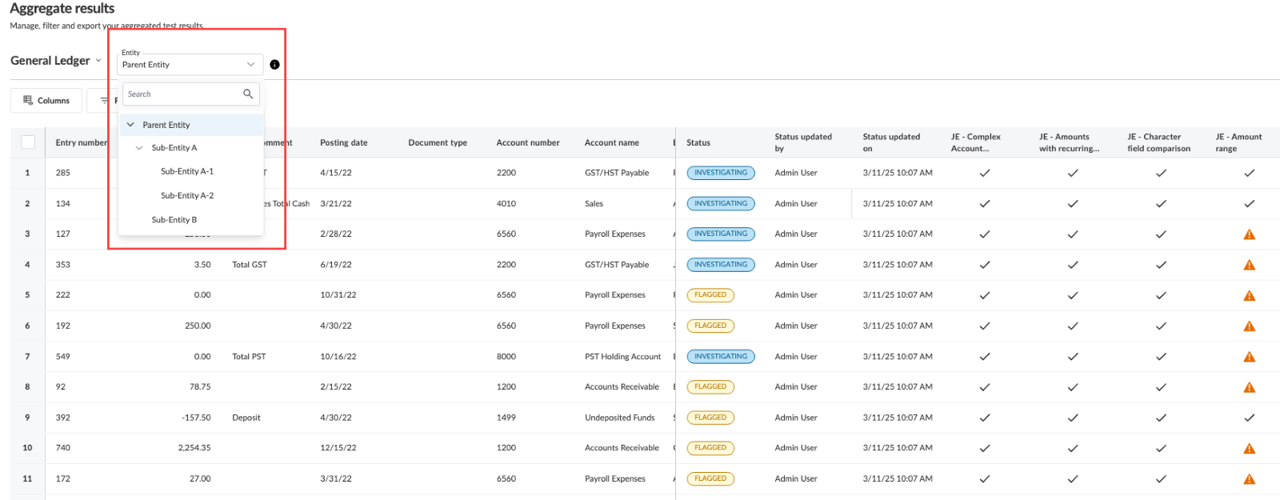
Aggregierte Ergebnisse nach Einheit anzuzeigen
-
Eine umfassende Überprüfung der Unternehmensdaten für genaue und fundierte Prüfungsschlussfolgerungen sicherzustellen
Die Funktion lässt sich nahtlos in bestehende Analyseabläufe integrieren und gewährleistet minimale Unterbrechungen der Benutzerabläufe.
Entsprechende Fehlermeldungen werden angezeigt, wenn die Berechtigungen unzureichend sind oder wenn einheitsübergreifende Datensätze nicht kompatibel sind.
Um diese Funktion zu nutzen, müssen Sie zunächst wissen, wie Sie ein konsolidiertes Engagement erstellen. Innerhalb eines konsolidierten Engagements können Sie das Mutterunternehmen oder eine beliebige Tochtergesellschaft auswählen, um deren Analyseergebnisse über die Registerkarte Analyse-Hub anzuzeigen.